Skip to content
My Chart Guide
  • Charts
  • Graphs
  • Diagrams
  • Reviews
  • Best of Best
  • Tutorials

bubble charts

Bubble Charts: Visualization for Multi-Dimensional Data

On January 12, 2026 by Ryan Sanchez
Bubble Charts

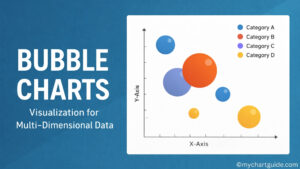
Learn what Bubble Charts are, how they work, their key uses, advantages, limitations, and step-by-step instructions to create Bubble Charts for multi-dimensional data visualization.

Categories Charts Leave a comment
Visme - Best Chart, Graph and Diagram Tool

Best Tools

  • Best Project Management Software
  • Best Gantt Chart Makers
  • Best Infographics Makers
  • Best Flowchart Makers
  • Best Venn Diagram Makers
© 2026 - My Chart Guide