
In today’s content-driven world, attention spans are short and the demand for visual clarity is high. That’s where infographics shine—they compress complex information into eye-catching, digestible visuals that educate, persuade, and inspire action. Whether you’re a content marketer, data analyst, educator, or entrepreneur, having the right infographic design tool can make all the difference.
The best infographic makers in 2025 aren’t just about pretty templates—they offer drag-and-drop design, data visualization tools, animation capabilities, collaboration features, and seamless export options. These platforms empower users to tell better stories with data, timelines, how-tos, and process flows—all with stunning design flexibility.
In this article, we’ve reviewed and ranked the top infographic creators for 2025. Whether you’re a design novice or a seasoned professional, these tools can help elevate your content and give your message the visual power it deserves.
1. Visme – One of the Best Infographic Makers for 2025
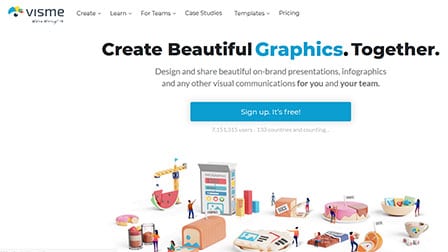
Visme stands out as a powerful and user-friendly infographic maker designed for professionals, educators, and marketers alike.
With its wide range of beautifully crafted templates and intuitive design tools, Visme makes creating impactful, data-driven visuals easier than ever.
Key Features:
- 1000+ Pre-designed Templates: Select from a vast library of professionally designed infographic layouts tailored for various industries and purposes.
- Drag-and-Drop Builder: Effortlessly create and customize infographics with an easy-to-use interface—no design skills required.
- Fully Customizable Elements: Add your own data, text, colors, brand fonts, and logos to make each infographic uniquely yours.
- Vast Asset Library: Access millions of stock photos, thousands of icons, 50+ charts and graphs, interactive maps, and animated widgets.
- Interactive Capabilities: Design dynamic infographics with clickable elements, hover effects, and embedded media.
- Flexible Export & Sharing Options: Download in formats like PDF, PNG, JPEG, or HTML5. Share via link, embed on websites, or post on social media.
- Privacy & Security Tools: Make infographics private, password-protected, or unindexable by search engines—ideal for sensitive content.
Pros:
- Extremely beginner-friendly with drag-and-drop functionality
- Rich library of templates and design elements
- Supports interactive infographics with media and animations
- Easy brand integration with logos, fonts, and colors
- Collaborative tools for team-based projects
- Export options suitable for both print and web
Cons:
- Some advanced features require a premium plan
- May feel overwhelming at first due to the vast number of options
- HTML5 export and full interactivity limited to paid tiers
Visme is an excellent choice for anyone looking to create eye-catching infographics quickly and professionally. Whether you’re sharing business insights, telling a story with data, or enhancing classroom materials, Visme combines functionality with visual appeal—making it one of the best infographic makers of 2025.
2. EdrawInfo
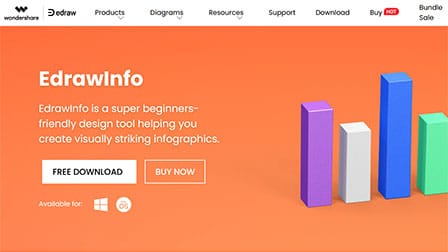
EdrawInfo, without a doubt, can be addressed as a superlative infographics creating software owing to its compatibility with Windows and MAC operating systems.
It is best known as a super beginner-friendly designing tool as it helps curate visually striking infographics in a jiffy. By merely following 5 simple steps, and by just enhancing the pre-existing templates, one can come up with some eye-catching infographics that have numerous streaks of customization.
This web-based platform is also in widespread use across bigwigs, such as Spotify, NASA, Illuminia, and Lufthansa among a host of others.
Additionally, with over hundreds of vector clipart elements, EdrawInfo supports the quick and effortless creation of compelling infographics that are highly customizable with respect to colors, shadow effects, lines, and chart values.
When it comes to saving the completed infographics, the application offers access to diverse variety of file formats, such as PDF, PPT, PNG, SVG, and HTML.
Pros:
- Compatible tool with multiple platforms
- Intuitive and easy to use
- Pre-made template access
- Simple UI
Cons:
- Customer service is disappointing
- Sharing tools aren’t prompt
3. Creately
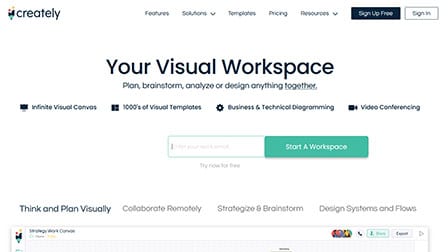
In a world where there is a heightened demand for informative images and graphics, platforms like Creately streamline the creation process.
The platform helps create unique, informative and versatile infographics and illustrations without any hassle.
Integrated with 1000+ infographic templates, Creately enables the users to create infographics in a matter of minutes. Also, the drag and drop editor makes the process a lot easier, enabling you to arrange text and images in no time at all.
With optimal collaboration features, Creately enables you to create infographics with the team in real-time. You can receive instant feedbacks and asynchronous editing further makes the process of collaboration a lot easier and organized.
Besides that, Creately also supports a variety of sharing options where users can export the final image in different formats, including PNG, JPEG, and even PDF formats. What’s great about this infographic maker is that it comes with a variety of editable templates.
Also, the tool has third-party app integration, enabling you to collaborate with different productivity apps like Google Docs, Sheets, Slides, etc. The professional diagramming feature streamlines the creation process. It also supports enterprise-level scalability.
Pros:
- Quite budget friendly
- Supports real-time collaboration
- Has editable templates
- Has web and desktop apps
Cons:
- Limited template selection
4. appypie
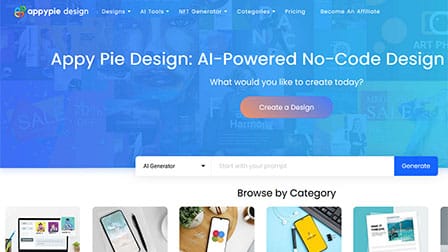
Not everyone wants to pay for an infographic maker and if you are one of them on the hunt for a good-quality and free infographic maker, appypie is a great option to look into.
The app has thousands of pre-made templates that you can choose from.
What’s great about this platform is the organized navigation. Every template on the platform is categorized into individual and respective categories, making it easier for you to pick a relevant template and work on it.
Since these are editable templates, all you have to do is enter your data, adjust the graphics, background color and fonts and you are left with a professional looking infographic in a matter of minutes.
Besides infographics, this platform is a versatile one providing access to different design options and the AI tools are here to make your design and creative process even simpler and organized. The free version of this app is more than enough to get your creative process in line.
However, if you are looking to access some of the premium features, their pricing plan is $6/month and offers access to unlimited projects, making it perfect for organizations.
Pros:
- East to use and set up
- Comes with 1000+ pre-made templates
- Editable templates
- Free version is more than enough
Cons:
- Lacks certain collaboration features
5. Canva
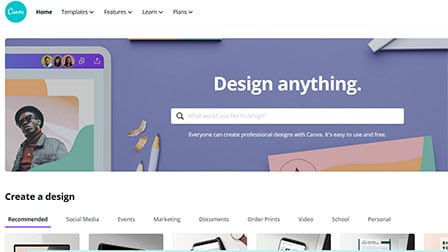
Adding graphics to your text-based content elevates the look and feel of a post. However, not everyone is a professional when it comes to creating infographics using high-end tools.
Canva is developed for the beginners, who want to create sleek designs without the technical hassle.
What sets apart Canva from its competitors is the fact that it comes with a free and resourceful version. Integrated with thousands of free templates and interchangeable design layouts, Canva shines through each and every time.
Besides staple commercial infographics, the tool also supports charts and graphs if you want to visualize your data, especially for presentations. The software also provides direct access to millions of icons, images and stickers to amplify the appearance of each graphics you create.
Once done, users can either download their final infographic or directly share it forward from their interface, streamlining the process even further for the users.
Pros:
- Free version is very resourceful
- Easy download and sharing
- Intuitive UI
- Beginner-friendly
Cons:
- Templates aren’t re-sizeable
- Lacks spell check feature
6. Snappa
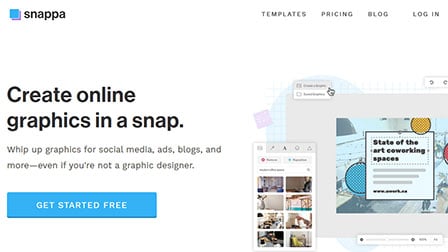
Snappa can be regarded as the best in business, subscription-based infographics making platform for non-designing professionals to come up with eye-catching and visually appealing infographics and other graphical charts.
The graph making procedure can be completed in just 3 simple steps with the help of over hundreds of colorfully attractive and easily customizable templates. This can save a lot of time for the user as the designing aspect is looked after by the inbuilt templates.
This online tool is configured with preset infographic dimensions and offers over 7 million stock images that can be used to add value to the infographic.
These high-resolution images are freely accessible in the application and can be used as background pictures in the infographic.
Besides, there is an enormous variety of text, graphics, and shapes in the tool that can be altered to furnish a user-satisfying infographic, which can be later saved and shared.
Pros:
- Diverse templates
- Easy export of the final infographic
- Beginner-friendly
- Affordable pricing
Cons:
- Only supports web client
- Limited features in free version
7. VistaCreate
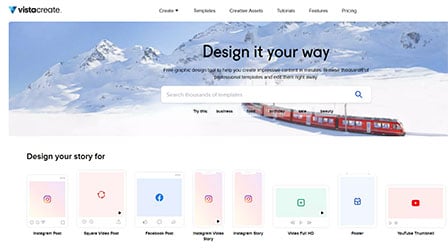
VistaCreate can be deemed as one best infographic maker for 2025, compelling its users to stop writing statistical data in a boring old-fashioned way and project it in style.
By creating designs from scratch or using any of its professionally-designed templates, one can easily and effortlessly craft some engaging and beautiful-looking infographics.
This tool comes with affordable plans and is loaded with all the necessary objects and features to create an awesome-looking infographic devoid of any prior design experience.
Apart from templates, VistaCreate lets you play around with fonts, and animate the graphics by incorporating various stunning charts and lists, while embellishing them with design objects.
One can also customize the infographics with an assortment of elements and add animated effects to the text blocks and images. Another best part about this application is that it lets you upload your own content and customize the dimensions of the illustrations.
Pros:
- Variety of templates
- Supports uploading own images
- Easy to use
- Easily editable templates
Cons:
- Video library isn’t that impressive
- Alignment settings aren’t that great
8. Piktochart
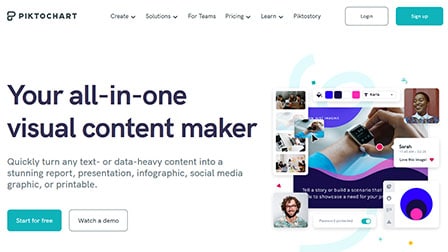
Piktochart is a popular infographic making application that lets you craft eye-popping infographics with perfect images, illustrations, and icons.
Apart from offering a free library of graphics, the tool comes with good-looking and easy to customize templates, as well as design components.
One can also spice up their infographics with images to make the content more beautiful. The main highlight of this portal is that it helps you translate complex data into visual stories, making it the most recommended infographic maker in 2025.
The brand assets feature of Piktochart makes sure that the content of the infographic is customized and always on-brand in seconds.
Using the robust charts and maps of the application, one can also quickly translate their data into an infographic to grasp the audience attention. Another perk of this tool is that it offers automatic data updating as the graphs are linked to Excel or Google Sheets.
Pros
- Beginner-friendly
- Easy to use
- Detailed templates
- Optimal customization tools
Cons:
- Graphs and charts features are limited
- Layering features are complicated
9. Venngage
Venngage is an online application that is highly popular for creating data visualization structures, mainly charts and infographics.
This tool is in excessive use across over twenty-one thousand businesses in the world with Harvard University, Google and Airbnb as its prominent clients.
Its presence in these esteemed organizations can be attributed to its ease of operation in creating the infographics that take less than 3 steps and over 5 minutes.
There are around hundreds of professionally articulated inbuilt templates rendered by this application which can be used as a base for the infographic in order to further add texts, charts, icons among other visuals.
The infographic can be later customized and branded as per company specific choice of colors and styles. The finalized structure can also be updated or altered whenever needed.
This simplicity of personalization of the graph makes Venngage the most desirable infographic maker among users across the globe.
Pros:
- Sleek and professional visual tools
- Diverse library of templates
- Has a trial version
- Quick processing
Cons:
- UI could be a little less complicated
- Templates are hard to readjust
10. Infogram
An easy to use, and internet-based graphical application, Infogram helps its users to furnish interactive infographics in a matter of a few minutes, without stressing the need for any designing or coding skills.
This tool is highly preferred by individual employees or team members, specifically across the corporate vertical as the infographics can be generated and made stunningly appealing with a variety of animations.
These end-users can get hold of on-point geographical, hierarchical, anatomical, data-centric and a dozen other categories of infographics through this online application.
Infogram is inbuilt with an ample number of maps, charts, icons, widgets, and professional images to assist its users for the ease of customization.
Also, there are more than 200 templates rendered by the tool that can be picked to start creating the infographics to take them to the next level with regard to content placement and design. Hence, this application is highly recommended.
Pros:
- Easy integration tools
- Amazing collaboration features
- Wide variety of templates
- Easy to use
Cons:
- Embedding features are faulty
- Only web-based solution
About Infographics
Infographics as the name indicate deals with the management of large amounts of information on a graphical body and can be described as a concise composition of charts, minimum textual data and images.
They are mainly employed to make hard to digest but vital information, easy to read and understand that would otherwise seem boring as a plain, repetitive text that would miss the reader’s eye for important facts and figures.
The proper placement and distribution of this data reduces its complexity, making it entertaining, eye-pleasing and easily perceivable to the user.
- You may like: Making Infographics in 8 Simple Steps [Infographic]
Infographics are extensively adopted to turn crucial and data-rich concepts into illustrative stories that are abundant in images, maps, styles, fonts, charts and colors, and various other branding elements to increase the user engagement.
These structures can be resized, reshaped and conveniently customized with the help of existing templates or can be built from scratch to match the end-users needs.
This property of the infographics to merge attractive text, images and elements make visitors spend more time capturing all the information.
Taking note of their superior and value-rich dimensions, they have gained immense limelight for personal, educational and corporate use in comparison to presentations or word documents.
This can be attributed to the immense need to bring creativity and quick understanding of concepts in the education vertical and garner a lot of consumer traffic and enhance brand awareness in marketing scenarios.
They are also well-versed to highlight statistical data that needs to be communicated to the specified audience.
Verdict
Taking insights from the aforementioned top-ranked infographic making applications, one can say that all these online tools and software bring visually impressing and value-added graphics to the user’s table in seconds.
Almost all these graphical editors ensure the creation of the infographics with the help of an extensive palate of colorful templates that can be then loaded with an impressive amount of visual elements.
Applications like Easel.ly and Lucidpress do not necessitate any payment formalities and can be accessed by the users at zero registration costs, making them a standard choice specifically for designing across fresher’s and students.
On the other hand, Visme and Venngage are witnessing increasing presence across leading and renowned brands that operate across the globe.
Infogram and Snappa are known to bear some subscription costs but are highly recommended for generating customized infographics to cater to the surging professional and corporate purposes.
While online tools like PicMonkey and Piktochart along with Adobe Spark allow their users to turn some complex data into advanced design-abundant infographics by consuming minimum time and efforts.
On a final note, these 10 infographic maker serve the same purpose of furnishing top-class graphical and animated illustrations while offering modernized personalization benefits.
Hi! Thank you for including Piktochart in your list of best infographics tools!