
In the fast-evolving world of data visualization, online chart makers have become indispensable tools for businesses, educators, and designers. By 2025, these platforms have integrated cutting-edge AI, enhanced collaboration, and intuitive design features. Here’s an in-depth look at the top 5 chart makers leading the charge this year.
1. Visme

Overview
Visme remains a powerhouse for creating dynamic charts, infographics, and presentations. By 2025, its AI-driven design suggestions and live data integrations make it a favorite for marketers and educators.
Key Features (2025 Updates)
- AI Chart Advisor: Automatically recommends chart types based on uploaded data.
- Live Data Sync: Connects to APIs, Google Sheets, and Excel for real-time updates.
- Multimedia Integration: Embeds videos, GIFs, and hyperlinks directly into charts.
- Brand Kit Pro: AI-generated color palettes and fonts aligned with your brand.
Pros
- Stunning templates for non-designers.
- Robust animation tools for interactive reports.
- Advanced collaboration with role-based permissions.
Cons
- Steeper learning curve for advanced features.
- Limited offline functionality.
Pricing
- Free plan (limited exports).
- Starter: $12.25/month.
- Pro: $24.75/month (unlocked AI tools).
Verdict
Visme excels in blending data storytelling with visual flair, ideal for content creators needing polished, engaging visuals.
2. Creately
Overview
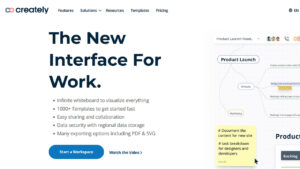
Creately shines in technical diagramming and agile workflows. Its 2025 updates focus on project management integrations, catering to remote teams.
Key Features (2025 Updates)
- Smart Diagramming AI: Generates flowcharts from text prompts.
- Async Collaboration: Leave comments and track changes across time zones.
- Jira/Asana Sync: Update tasks directly from diagrams.
- Infinite Canvas: Zoomable workspace for complex mind maps.
Pros
- Intuitive drag-and-drop interface.
- Real-time collaboration with video chat.
- Affordable for small teams.
Cons
- Fewer templates compared to competitors.
- Limited data visualization customization.
Pricing
- Free plan (5 diagrams).
- Team: $8/user/month.
- Enterprise: Custom pricing (SSO, audit logs).
Verdict
Creately is a top pick for developers and project managers needing seamless diagram-to-workflow integration.
3. Lucidchart
Overview
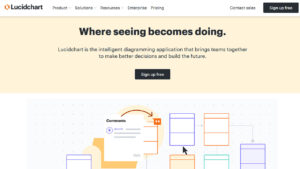
Lucidchart dominates enterprise environments with its security and scalability. 2025’s upgrades include AI-powered compliance checks and enhanced interactivity.
Key Features (2025 Updates)
- Compliance Guardian AI: Flags GDPR/HIPAA risks in charts.
- Interactive Prototyping: Turn flowcharts into clickable demos.
- Google Workspace/Microsoft 365 Deep Dive: Edit charts within Docs or Teams.
- Data Layers: Overlay multiple datasets in a single visualization.
Pros
- Enterprise-grade security with SAML/SSO.
- Extensive shape libraries for technical users.
- Smooth integration with Atlassian tools.
Cons
- Expensive for solo users.
- Overwhelming for simple projects.
Pricing
- Free plan (basic features).
- Team: $9/user/month.
- Enterprise: Contact sales.
Verdict
Lucidchart is unmatched for large organizations prioritizing security and cross-platform synergy.
4. Edraw Max Online
Overview
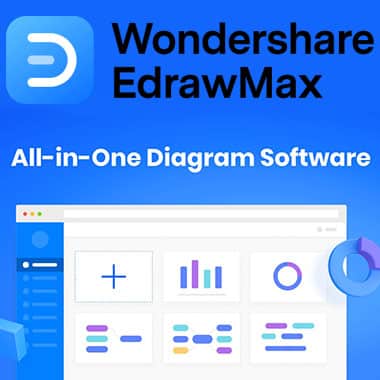
Edraw Max Online balances affordability with versatility, offering 280+ diagram types. Its 2025 focus is on AI accessibility and cross-device optimization.
Key Features (2025 Updates)
- AI Assist: Voice-to-chart functionality for hands-free design.
- Offline Mode: Work without internet; syncs when reconnected.
- 3D Charts: Rotate and animate 3D bar/pie charts.
- One-Click Export: Publish to WordPress, Shopify, or PDF.
Pros
- Budget-friendly with perpetual licenses.
- Supports Visio files.
- Strong customer support.
Cons
- Dated UI compared to rivals.
- Occasional lag with complex diagrams.
Pricing
- Free plan (100MB storage).
- Annual: $99/year.
- Lifetime: $249 (one-time fee).
Verdict
Edraw Max is perfect for budget-conscious users needing diverse diagram types without subscription hassles.
5. Canva

Overview
Canva continues to democratize design with its user-friendly chart maker. 2025’s updates include TikTok/Instagram integration and AI-driven analytics.
Key Features (2025 Updates)
- Social Live Sync: Auto-resize charts for Instagram Stories or LinkedIn.
- Magic Chart Animator: Transform static charts into animated reels.
- Data Insights AI: Suggests trends based on your data.
- Team Brainstorm Mode: Collaborative whiteboards with sticky notes.
Pros
- 500,000+ templates for all industries.
- Drag-and-drop simplicity.
- Free plan with generous assets.
Cons
- Limited advanced chart customization.
- Watermarks on free exports.
Pricing
- Free plan (basic features).
- Pro: $12.99/month (unlock animations).
- Teams: $14.99/user/month.
Verdict
Canva is the go-to for influencers and small businesses needing quick, stylish charts for social media.
Final Comparison
| Tool | Best For | Standout Feature | Price Range |
|---|---|---|---|
| Visme | Branded storytelling | AI Chart Advisor | $12–$25/month |
| Creately | Agile teams | Jira/Asana Sync | $8–$15/user/month |
| Lucidchart | Enterprises | Compliance Guardian AI | $9+/user/month |
| Edraw Max | Budget users | Offline Mode | $99–$249/year |
| Canva | Social media visuals | Magic Chart Animator | $0–$15/month |
Conclusion
Your choice depends on needs:
- Teams: Lucidchart or Creately for collaboration.
- Solo Creators: Canva or Visme for ease and flair.
- Cost-Conscious: Edraw Max for lifetime value.
In 2025, these tools blend AI, interactivity, and cross-platform prowess to turn raw data into compelling narratives. Whether you’re a startup or Fortune 500, there’s a chart maker here to elevate your visual game.
