Data visualization is the peak of success at the moment. With everything propelled by technology and the constant drive for improvement in the technological advances, nothing is not written in blocks of paragraphs.
Chart making or diagramming is gradually taking a front seat in this prospect, one that you didn’t even think would have been possible.
But, the problem is that nobody was born a pro in developing charts. This is the reason why there are so many available free as well as pain chart maker online that you need to know about.
10 Best Free and Paid Online Chart Tools 2023
As we did mention before, we searched through the internet, looked through the reviews and sorted out the top 10 chart tools that we know will help you drive your business towards success.
Let us walk you through the best ones in order, shall we?
Best Charts, Graphs, and Diagram Tools
- 10 Best Online Chart Maker of 2023
- 10 Best Microsoft Visio Alternatives 2023
- 10 Best Org Chart Maker of 2023
- 10 Best UML Diagram Tools 2023
- 10 Best Entity Relationship Diagram (ERD) Tools 2023
1. Lucidchart
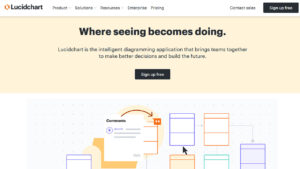
Lucidchart is an online visual workspace which streamlines workflow and management with the aid of diagramming, data visualization and better representation of the thoughts to further drive innovation.
The unique approach of this specific online chart is what further helps drive better growth and popularity of the platform.
This online chart maker helps you keep track of the actionable insights to further elevate the quality of the work along with the efficiency as well.
Graphical representation of the same ensures an interactive approach to the understanding of a subject which is often the foundation for better growth of the business.
Features
- Helps in styling shapes easily in the diagram.
- Better clarity in the diagrams.
- Enhanced keyboard shortcuts for better efficiency.
- Inclusion of containers for better arrangement of diagrams.
- Inclusion of links helps better understanding.
- On the platform collaboration for streamlined performance.
Pricing
- Free: No money to spend and provides with easy sign up and free access to templates.
- Pro: $9.95 per month when paid annually and includes all the necessary features.
- Team: Starts from $20 per month for three users.
- Enterprise: Need to get personalized quotes.
2. Edraw Max Online
For effective planning and collaboration of data with online charts, Edraw Max Online is a highly preferred portal as it is freely available to all its users.
Given that this application provides around 280 diagram types that cater to almost any sort of visual needs, spanning flowcharts to circuit diagrams, it stands out as an all-in-one online platform.
Apart from being configured with an interactive interface, the tool offers ease of navigation in the chart making process.
What makes Edraw Max Online an ideal and visual workplace for individual users and the team is that it lets them collaborate and co-create with cross-functional stakeholders.
In addition to this, the application delivers an engaging, intuitive, as well as seamless collaboration experience on an infinite canvas to facilitate teamwork.
Assistance in keeping the project connected and the creation of charts through real-time synchronous cloud workplace are some perks of using this tool.
3. Visme
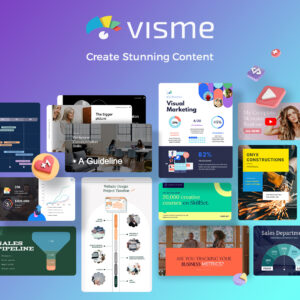
Visme is yet another one of the popular online chart preparing platform that helps enhance your chances of conversions with graphical representation of ideas and better implementation of data visualization.
This one predominantly focuses on the development of the infographics or the presentations that you need to get done on your job or for your business.
It is a very powerful tool that helps narrate visual stories without the complications of hard task involved in it. The platform is quite easy to use and has some of the best features to further ensure seamless work done for your business.
Features
- Helps in creating engaging designs that convert and draws in audience.
- Is a storehouse of hundreds of infographic and presentation templates to choose from.
- Full immersive experience with on spot addition or even editing of the content involved for the picture.
- Easy share or download options to further keep the work safe and secure and use it whenever you need.
- Trusted by over 3 million marketers from some of the big names in the industry.
Pricing
- For individuals
- Basic: Free.
- Standard: $14 per month when paid annually.
- Complete: $25 per month when paid annually.
- For business
- Single: $25 per month when paid annually.
- Team: Starts from $75 when paid annually.
- Enterprise: Need to contact to get personalized quote.
4. Creately
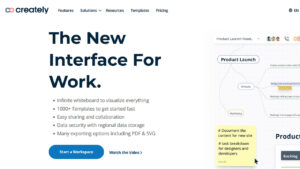
If you visualize ideas, Creately can bring them to life. It helps with visual conceptualization and helps you create, plan and collaborate on the platform.
It is integrated with some of the most popular intuitive drawing tools that further ensure maximum drive to the business’ growth.
With a loyal customer base amounting to 3 million now, this is an important spot that you need to know of.
Features
- Helps create the ideas that you are visualizing to further streamline the end results.
- Real time collaboration for on the spot inputs and edits.
- Chic and professional appearance without any further questions.
- Helps you choose from over 1000s of templates to look through.
Pricing
- Public: Completely free.
- Personal: $5 per month when billed annually.
- Team: Starts from $25 per month when billed annually.
5. Canva
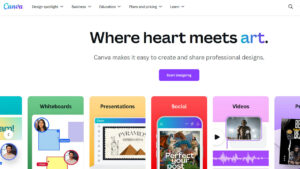
When it comes to creating graphics and illustrations with no prior knowledge, nothing beats Canva as a software.
It is a dream to work on this comprehensive software that enables even the most novice creator to design a stunning chart in under a minute.
With Canva, your data visualization process shouldn’t take anymore than a minute. Also, Canva isn’t complicated or time-consuming at all. Once you are registered and signed in, all you need to do is look up the template you want to work with and then edit on the go.
The free plan is more than enough to suffice all your online chart making needs, so you won’t have to worry about paying the Premium price at all. There are over 20+ pre-made professional templates you can work with.
Best Charts, Graphs, and Diagram Tools
- 10 Best Online Chart Maker of 2023
- 10 Best Microsoft Visio Alternatives 2023
- 10 Best Org Chart Maker of 2023
- 10 Best UML Diagram Tools 2023
- 10 Best Entity Relationship Diagram (ERD) Tools 2023
Besides the creation process, the sharing and embedding process is even easier with Canva. The tool comes with drag-and-drop features that allow you to create the chart or graph in very limited time and without any prior editing knowledge.
Since the templates are designed by professionals, you can be assured that the final result never disappoints and is always on par with your brand’s marketing goal and the requirements.
6. Vizzlo
Owing to its versatile and intuitive data visualization workspace, Vizzlo can be accredited as one of the most extensively used online chart maker in the current times.
This application helps you to furnish some world-class and designer diagrammed representations in less time.
Vizzlo comes easily handy to its users as it can be accessed through any desktop browser. Once into the application, the users can start using their free trials and can pick from various options for basic and affordable monthly and annual subscription plans.
Vizzlo is best known for offering its logged-in users with an optimum selection of over 100+ chart structures that range from a variety of bar and column, circular, line and area, pictorial, bubble & scatter plots as well as process and structure diagrams.
One can also come up with time-based graphs like timelines and circular agendas, apart from gauges and status charts through this application.
Pricing
- Free plan with limited features.
- Professional: $11 per month when paid annually.
- Teams: $45 per month for 5 seats when paid annually.
- Enterprise: Contact directly for high-volume pricing.
7. Miro
Miro is another multipurpose diagramming tool that has been around for years now.
What’s great about Miro is the functionality, especially when it comes to the aspect of data visualization. You can present your ideas with a design boost, propelling your projects forward.
The built-in chart maker on Miro is very comprehensive, detailed and easy to edit. All you need to do is pick the template and then work as you go. From marketers to students, the chart maker can benefit more or less everyone looking to create a professional looking online chart and graph.
The robust editing features on Miro streamline your design process and storytelling, special thanks to the templates library and the community it has built for itself. Ideal for beginners, using Miro doesn’t require you to have any preconceived knowledge or experience, which is always an upside.
From adding labels to variables, with Miro, you can streamline just about anything your heart desires when it comes to data visualization.
Also, it has an extensive line-up of collaboration tools, which allow real-time editing and collaboration with multiple users. You can get started with Miro without a glitch and then extrapolate your online chart creation for a very affordable price.
8. Microsoft Visio for Web
The Microsoft Visio for Web is yet another online chart maker that you can peek into if you plan on changing your thoughts into graphical representation for it to be perceived along better by the clients.
This has a very easy to use user interface that you wouldn’t necessarily have to worry about or get confused with.
It lets you create professional diagrams and help engineer better charts and graphical representation for improved presentation.
- You may like: Best Microsoft Visio Alternatives
It also helps promote better collaboration with the other team members to further streamline the work in a single space without creating further chaos.
Features
- Helps in the creation of professional charts including flowcharts, floor plans, org charts and even modern shapes.
- Promotes collaboration on the sheets and diagram to drive better growth and easier interaction.
- Provides with real time insights for further understanding of the ideas.
- Web access ensures that you can access and use it from anywhere across the world.
Pricing
- Visio Online Plan 1: $5 per month per user to be paid annually. Includes all the basic features to start using the chart marker.
- Visio Online Plan 2: $15 per month per user to be paid annually. Perfect for IT users who need better access to tools for diagramming. Includes the web and desktop application both under this plan.
9. Adobe Express
With how accessible technology has become, there’s not need to manually do anything anymore. The same applies to the chart you are designing for your presentation.
With Adobe Express, you don’t have to engage in the hassle of doing things by yourself.
The software is a customizable graph generator that houses different designs and types of pre-made professional templates that you can use to create an ideal chart all by yourself.
It has an easy to use design system, which is always an upside, especially for beginners who don’t have much knowledge about high-tech diagramming tools.
The software comes with free plan and a premium plan, however the free plan is more than enough to get you through all your chart making requirements.
Besides the pre-made templates, users also get access to unique Adobe fonts, Adobe Stock royalty-free photo collection, cloud storage and so much more with this tool.
What’s great about Adobe Express is the accessibility as well. Not only do you have access to the web version, Adobe Express also has a mobile app you can use to streamline your user experience for the better, especially when you are on the go.
10. Venngage
Venngage is another popular and highly compatible online chart maker that displays your complex data into a more organized and attractive manner.
From presentations to reports, Venngage allows you to create some stunning online charts in under a minute.
Trusted by 40,000+ business and individuals, Venngage is designed for beginners who have little to no knowledge about graphics and how things unfold in that world. With easy to edit templates and pre-existing graphics elements, this is an online chart maker that’s here to make your life a lot easier.
This intuitive graph maker is multipurpose and works effortless in presentations, lectures and even elaborate marketing campaigns. With Venngage, it takes you a few minutes to transform your raw data into graphics. Also, it has easy integration with Google Sheets, which is always a bonus too.
Venngage has a user-friendly editor and multiple downloadable formats for the online charts, making things a lot more intuitive and accessible as well.
No longer will you have to struggle with the fonts and visuals because it has a library of thousands of free and premium accessories to spruce up your chart design.
Furthermore, with 24×7 customer support, you won’t have to worry about facing any complications. They work with you round-the-clock.
Related:
- Best Organizational Chart Software (Tools)
- Best Entity Relationship Diagram (ERD) Tools
- Best UML Diagram Tools
How does data visualization and charting help business growth?
Charting or diagramming is a form of visual representation of data in the form of flow charts or even bubble diagrams to ensure easier understanding of the concept involved.
Given that we are here discussing about the tools available on the internet for the use of making charts, isn’t it better that you first understand the kind of benefits that charting has on the growth and overall development of the business?
That being said, we thought we’d share some important list of benefits why charting is important for you to then select which tool suits your requirements the best.
1. More effective action
One of the most common benefits of charting that business professionals have reported about is faster action.
Since the charts are so well devised and articulated with a simple graphical representation, it makes it easier for the people to understand. The faster they understand the concept, the easier it is for them to take an effective action for the same.
2. Better communication
Charting is a very interactive way of presenting data. Not only does it provoke interest in the minds of the people, it also helps them get a better perspective on what the project or the subject is about.
When the decision maker of the industry can understand things easier, you know that your chart is communicating exactly what you are trying to convey. This is one of the reasons why carting is still a very important mode of project presentation.
3. Better linking between operations and results
One of the best benefits of the data visualization is that it helps the users involved track the connections involved with the operations and the results.
Having a better idea about the overall business functions and the market performance ensures to help the businesses sustain well in the environment around. It also helps in ensuring that the progressing operations do results into the expected results that one expects in the end.
4. Blending in with the trends
Trends are important and key driving factors in the market. If you want better results from the get go, it is important that you follow along with the trend and the data visualization is possibly one of the biggest one in the market at the moment.
For keeping up with the consumer behaviour, it is also simultaneously necessary that one keeps an eye out on the emerging trends.
Big data visualization and charting helps make the process of understanding the key market trends a lot easier. It helps monitor some of the key indicators and even the growth driving factors for the said trend.
5. Better chances at discussion
Better ideas are churned with better discussions. If you wish to drive better impacts for your business, the one thing that can help project better discussion is with data visualization and charting.
Given that these are easy to decipher, decode and understand, it helps in propagating better discussions without further delay.
The tools used for the big data visualization has been found to have amazing impacts in helping drive better insights which later lead to extensive brainstorming and discussion which further give birth to more ideas.
6. Keep a steady track
With big projects, it is often hard to keep up with the progress which might not seem to have direct impacts in the time being but can end up causing a chaos if the needful steps are not taken.
Charting helps in keeping a track of the progress of the project in a graphical representation to make the process more interesting and effective in terms of the outputs.
Knowing the status of the project also ensures to chop down on some of the unwanted lags that could cost a lot in the end. It acts as an effective prioritization tool to know what one needs to focus on at the moment and what can be checked out later.
All that being said, in order to imbibe and experience these benefits, you need to know the tools that can help you with the process of charting. To help you better, we are going to share some of the best tools that we thing you’d enjoy using.
Verdict
If you are tired of being in a stagnant market, you need to do something that stands out. Preparing online charts and opting for data visualization is possibly the best way to churn better results from the prospects.
Not only are these interactive, they are also quite amazing in terms securing deals and making prospects understand your vision on the screen or on a piece of paper.