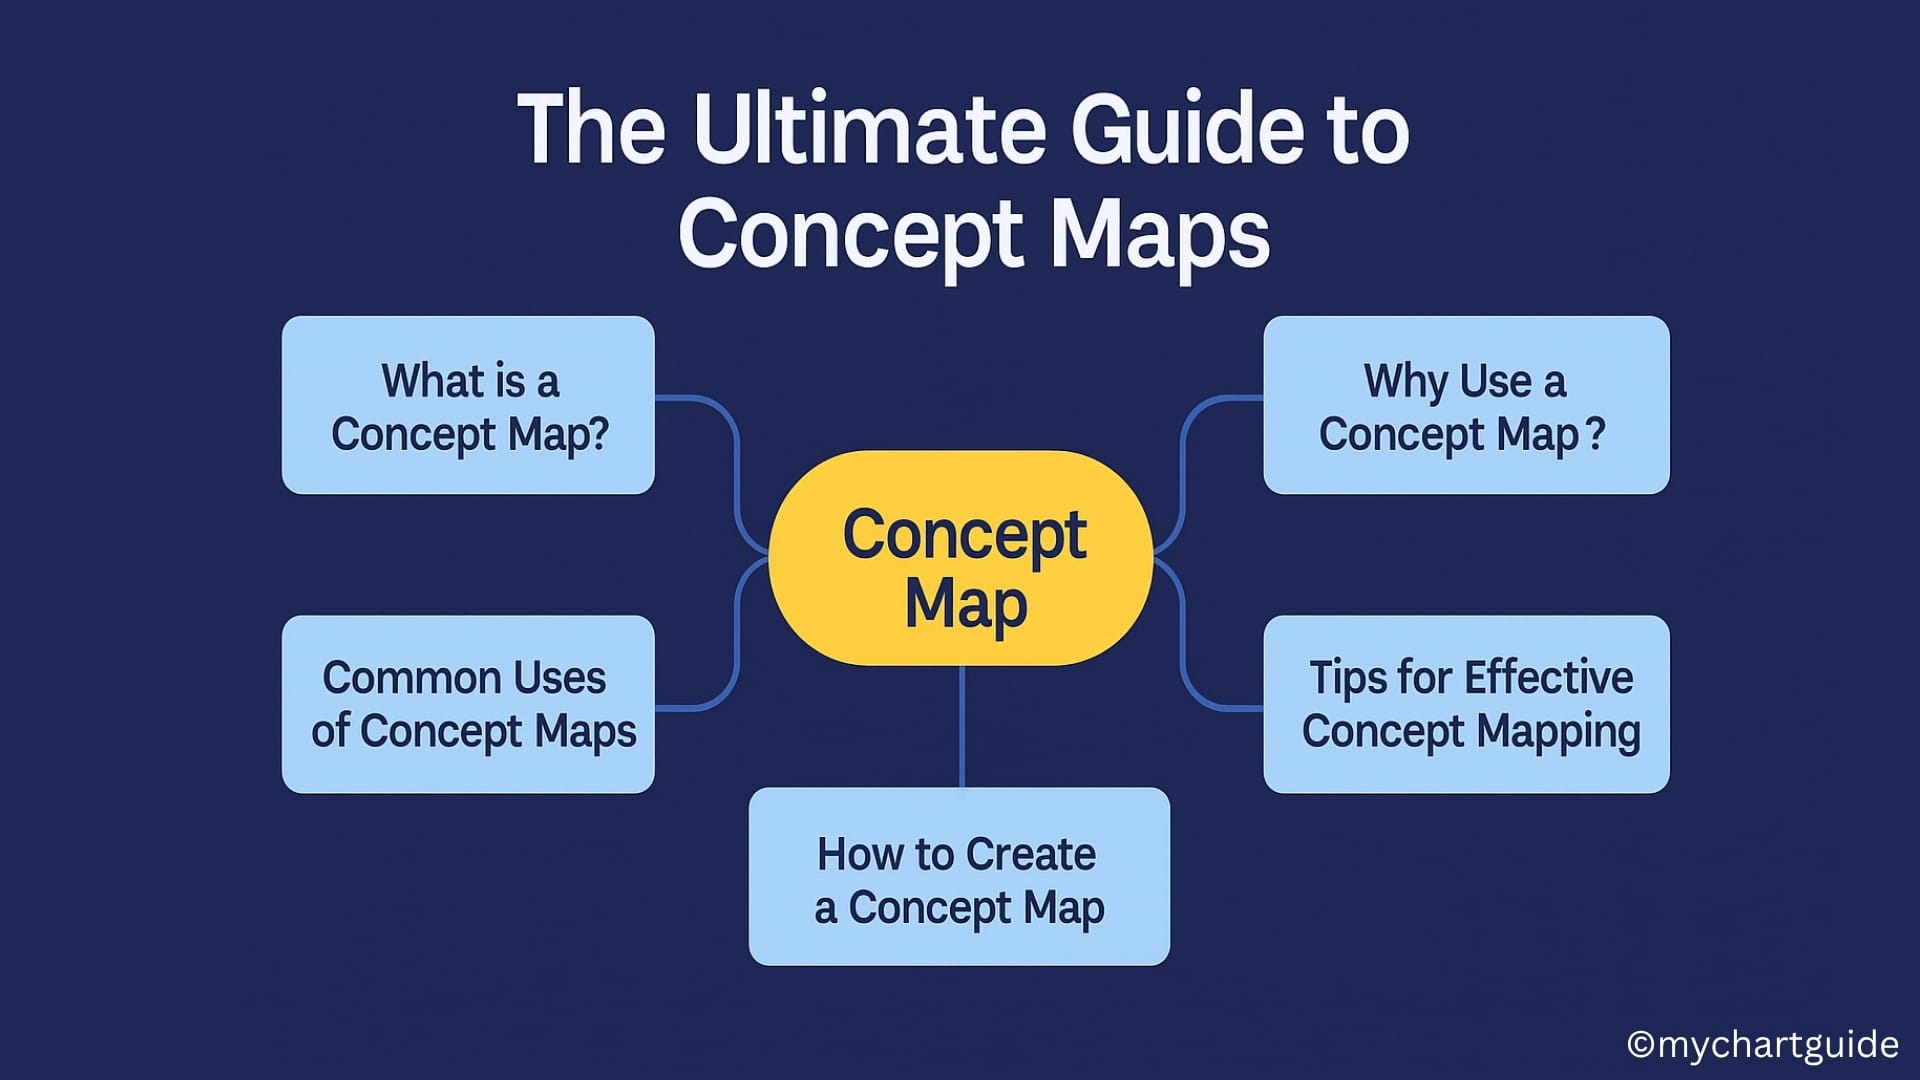
A concept map is more than just a diagram—it’s a powerful visual tool that helps you structure knowledge, enhance learning, and improve understanding. Whether you’re a student trying to study better, a teacher organizing lessons, or a business professional simplifying complex systems, concept maps can streamline and clarify information effectively.

By visually representing connections between ideas, they allow for deeper analysis, improved memory retention, and more organized thinking. In this blog, we’ll explore what a concept map is, its uses, how to create one, and the benefits it offers in both academic and professional settings. Let’s dive into the world of concept mapping.
Introduction: What is a Concept Map?
A concept map is a visual tool used to organize and represent knowledge. It involves creating diagrams that show relationships between ideas, typically with concepts enclosed in circles or boxes and relationships denoted by connecting lines and linking words. Developed by Joseph D. Novak in the 1970s based on the learning theories of David Ausubel, concept mapping is used widely in educational, corporate, and research environments to simplify complex ideas and promote meaningful learning.
Why Use a Concept Map?
Concept maps go beyond memorization. They promote deep understanding by helping you:
- See the big picture and understand how ideas interconnect.
- Identify knowledge gaps and misconceptions.
- Foster creativity and problem-solving.
- Enhance retention and recall.
- Communicate complex concepts effectively.
Common Uses of Concept Maps
1. Education:
Students and educators use concept maps to understand and explain subjects like biology, history, literature, and physics. It helps with curriculum design, lesson planning, and active learning.
2. Business:
In corporate settings, concept maps are used for project planning, strategic thinking, and knowledge management. They’re excellent tools for brainstorming and presenting data visually.
3. Research & Writing:
Researchers use them to map literature reviews, define hypotheses, or outline papers. Writers find them useful for planning blog posts, articles, or books.
4. Healthcare:
Medical professionals use concept mapping to understand patient diagnoses, treatment plans, or to train medical students.
5. Personal Development:
From goal setting to habit tracking and decision making, concept maps serve as personal productivity boosters.
Key Components of a Concept Map
- Concepts: Usually nouns, these are the main ideas placed in circles or boxes.
- Linking Words/Lines: Arrows or lines that connect concepts. Each line includes a verb or phrase that explains the relationship.
- Hierarchy: The map is usually structured from the most general concept at the top to more specific ones below.
- Cross-links: These show relationships between different branches or areas of the map.
Types of Concept Maps
- Spider Map: One central concept with ideas radiating outward.
- Flowchart: Sequential and process-based relationships.
- Hierarchy Map: Shows ranked concepts from general to specific.
- System Map: Illustrates how different elements influence one another in a system.
- Chronological/Timeline Map: Great for historical or sequential data.
How to Create a Concept Map: Step-by-Step
Step 1: Define Your Focus Question
Start with a central theme or question. This becomes the anchor point for your map.
Example: “What are the causes of climate change?”
Step 2: List Key Concepts
Jot down all the related concepts you can think of. Don’t worry about structure yet.
Step 3: Organize Concepts Hierarchically
Arrange your concepts from general (top) to specific (bottom). Place broader ideas closer to the main concept.
Step 4: Connect Concepts
Draw arrows between related concepts. Add linking words on each arrow to define relationships. Example: “leads to,” “causes,” “includes,” etc.
Step 5: Add Cross-links
Once your map starts forming, you may notice relationships between different branches. Add these cross-links to reflect deeper connections.
Step 6: Refine and Review
Check if the relationships are accurate, clear, and logically structured. Remove redundancies and improve link wording.
Tools You Can Use to Make Concept Maps
1. Pen & Paper:
Simple and effective for quick brainstorming or teaching sessions.
2. Microsoft PowerPoint or Word:
Use basic shapes and arrows to draw concept maps.
3. Google Drawings or Jamboard:
Great for collaborative concept mapping.
4. Dedicated Concept Mapping Software:
- Lucidchart – Drag-and-drop UI, templates, and integrations.
- Coggle – Real-time collaboration, easy sharing.
- MindMeister – Ideal for mind maps and concept maps.
- Miro – Whiteboard-style mapping for teams.
- Visme – Customizable templates and data integration.
Tips for Effective Concept Mapping
- Keep your map simple and uncluttered.
- Use colors and icons to differentiate concepts.
- Use verbs or action phrases as linking words for clarity.
- Group similar ideas using proximity and alignment.
- Get feedback if you’re using it for communication.
Concept Map vs Mind Map: What’s the Difference?
| Feature | Concept Map | Mind Map |
|---|---|---|
| Structure | Hierarchical and relational | Radiant and centered |
| Relationships | Multiple, with linking words | Simple connections, mostly radial |
| Linking Words | Yes, on lines | Rarely used |
| Best for | Understanding complex relationships | Brainstorming, note-taking |
| Focus | Knowledge representation | Idea generation |
Real-Life Examples
Example 1: Biology (Photosynthesis)
- Main Concept: Photosynthesis
- Linked Concepts: Sunlight → Chlorophyll → Glucose → Oxygen
- Relationships: “is absorbed by,” “is used in,” “produces”
Example 2: Business Strategy
- Main Concept: Business Growth
- Linked Concepts: Marketing → Sales → Customer Retention
- Relationships: “drives,” “leads to,” “enhances”
Benefits of Using Concept Maps in the Digital Era
- Collaboration: Teams can co-create and refine ideas in real-time.
- Version Control: Track iterations and improvements.
- Integration: Add media, links, and live data.
- Portability: Easily share or embed maps in presentations, websites, or documents.
- Clarity: Visual clarity in training, onboarding, or reports.
Conclusion
Concept maps are powerful thinking tools that enhance learning, simplify communication, and improve problem-solving. Whether you’re a student, professional, or lifelong learner, mastering concept maps will give you an edge in organizing knowledge and driving innovation. With digital tools and templates available today, creating your own is easier than ever.
