Besides the effective usage of Flowcharts in this video and in particular a key element of comedy in The Big Bang Theory’s depiction of their characters nature to apply logic and science to everything trivial. What stuck with me more is when I was going through the YouTube comments, I saw an entire thread of strangers who are presumably high school students talking about how their teacher showed this video to explain to them what is a flowchart and it’s use.
The thread was interesting and even reached a point where one random outcast decided to ask if they were all in the same class. You know how YouTube users are with their weird aliases.
Coincidentally a teacher even appeared in the thread and told about how he presented this video to the students in his class.
Not only this shows the use of effective integration of the media into educational curriculums but more importantly, it shows the various applications of a flowchart which is what I want to talk about.
What is a Flowchart?
Flowcharts are a pictorial description of a process. Everything has a process towards attaining an end goal whether it be a campaign objective for an advertisement, a character preparation/analysis for a film etc. It may seem complicated but if you decide to strip it down to it’s foundation, flowchart’s are essentially a guide.
Types of Flowcharts
Flowcharts have various types but below are the 4 most commonly used types of flowcharts.
1. Process Flowchart
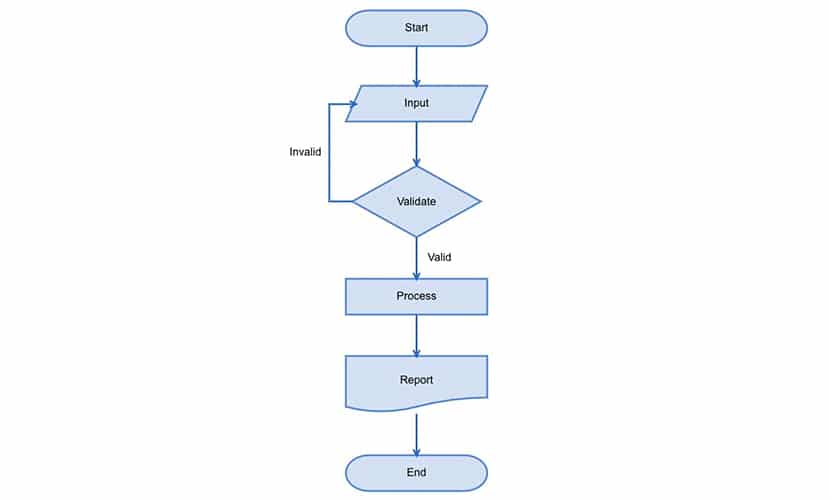
Even though we’ve established that flowchart is the pictorial depiction of a process, this type of flowchart is the most commonly used because of it’s simplicity in depiction. Besides organizational usage, Process flowcharts can be used for simple day to day plans as well for effective use of time
2. Swimlane Flowchart
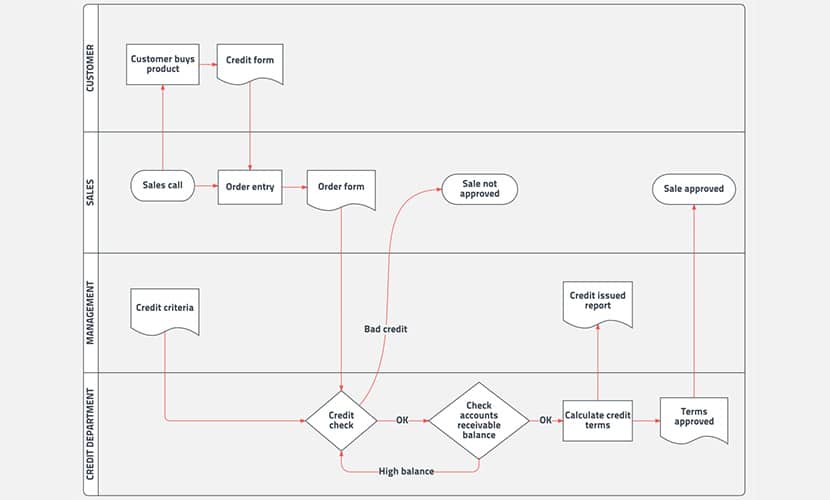
In Swimlane flowchart, two simultaneous processes are showcased to understand how things work and points where interaction happens between the two processes. For Example – In the case of creating a film, there are two sides A &B. Side A involves in the physical creation of the product which consists of 3 stages of production where during the pre-production stage locations are fixed for shooting, permission processing begins, casting directors scout & finalize Actors to portray various roles etc.
Once the actors for the movie are finalized, the team behind the physical creation gets on a talk with Side B who handles all the external related stuff from promotion, strategy, marketing, distribution etc. A date is finalized for release and they don’t meet until the physical product is completed. Simultaneously during shooting/production stage, Side B begins to create hype or talk in the market by pulling out various promotional bits, announcing actors involved in the movie, teasing video bits to create more excitement.
3. Work Flowchart
Work flowchart is mainly used internally within companies to show new recruits or educate existing recruits on how things function. The need for this arose because when the company was built initially, they created a foundation which worked for them and they’re more comfortable sticking to the foundation rather than introducing new processes. Call it a scripture of the company which all the employees have to follow. Workflow charts may include topics related to Communication flow of information from top to bottom. In Advertising there exists an internal agency workflow chart which different departments follow so as to get an idea executed.
4. Data Flowchart
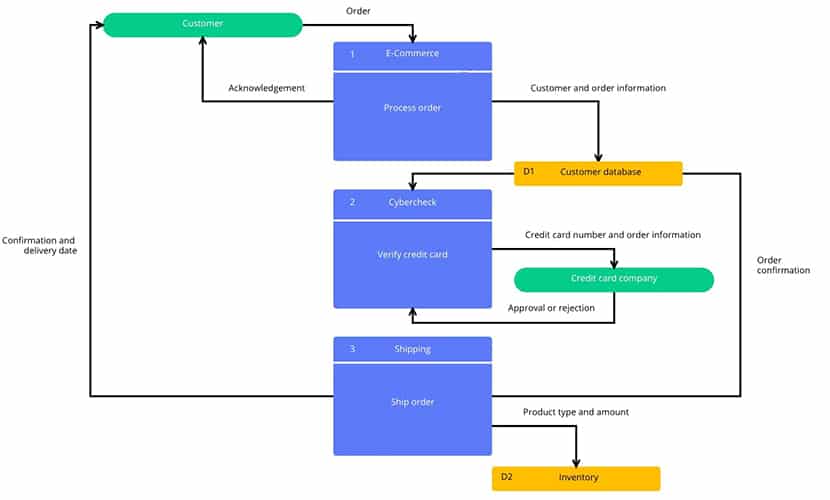
Gordon Gekko played by Michael Douglas in the movie Wall Street, had a line that went like this, “The most valuable commodity I know is information.” And that is what data is, information. With the help of information, everyone executes. Now the same information is also used to make flowcharts which are termed as Data Flowcharts. Data Flowcharts help executors understand how the system runs and tries to see if there can be room for improvement or if there are any flaws.
For Example – Strategists design a flowchart based on the data of your behaviour online, to induce you to buy a product. Suppose you were searching for the name of a jacket which you saw an actor from your favourite TV show wear. While searching for that jacket, the companies pick up on your behaviour based on keywords used during search and immediately suggests you a similar great collection of jackets from Brand X which induces you to click the ad and go to the website. You’ll browse the website , look at their collection and prices, try and search for reviews, check the brand out on their socials, see if delivery is free and end up buying a jacket or not. It’s a 50/50 case scenario. And there is a chart depicting this behaviour which analysts use to understand how better to convert that 50/50 to a 100% sale.
Advantages of Flowchart
Some of the well known Advantages of Flowcharts include the following
- Flowcharts help in effective communication of information across all hierarchies.
- They are time saving in terms of problem analysis and setbacks.
- Flowcharts also serve as foundations for the creation of new processes.
- Timely maintenance is required after the development of a program. Flowcharts make the job easier.
Technology has played a vital role in helping ease both the use of flowcharts and creating improvements in the design and structure to not only save time but to also make it easier to understand. Some of the most commonly used Flowchart makers include Microsoft Visio, Creately, LucidChart etc.
Lucidchart is known to be one of the most convenient due to it’s excellent real time collaboration. They also have more intelligent shapes to use as one of the drawbacks of a flowchart before was the limited number of usable shapes and their difficulty. Lucidchart constantly provides updates for new features and their customer satisfaction level is 10/10.
Microsoft Visio is the default program used by Management & HR Professionals. The main advantage is the ability to make timely updates and changes easier through the software. The flexibility in these changes take time during the initial setup but once setup, the process becomes much easier.
All systems and programs are not perfect. Neither are Flowcharts. They are very time consuming and even complicated sometimes. But the benefits outweigh the setbacks. Without the invention of flowcharts, internal communication process inside an organization would be chaotic. Even though time is invested in creating flowcharts, it compensates for the time which is spent on finding flaws in a process which are to be rectified.
Our perspective on these programs and tools is how we find new ways to use them to our benefit. If we dwell on the negative, we do not move forward. If we realize the alternative situations, we are more motivated to use what we have to it’s full potential. It all depends on how you see things.