Data visualization plays a vital role in simplifying complex datasets and making insights easier to understand. While bar charts, pie charts, and line charts are the most commonly used, advanced visualizations like Mekko Charts (also known as Marimekko Charts) offer deeper and more structured insights, especially in business and strategic analysis.
In this detailed guide, we will explore what a Mekko Chart is, when to use it, its variations, benefits, limitations, and how you can create one effectively.
Contents
What is a Mekko Chart?
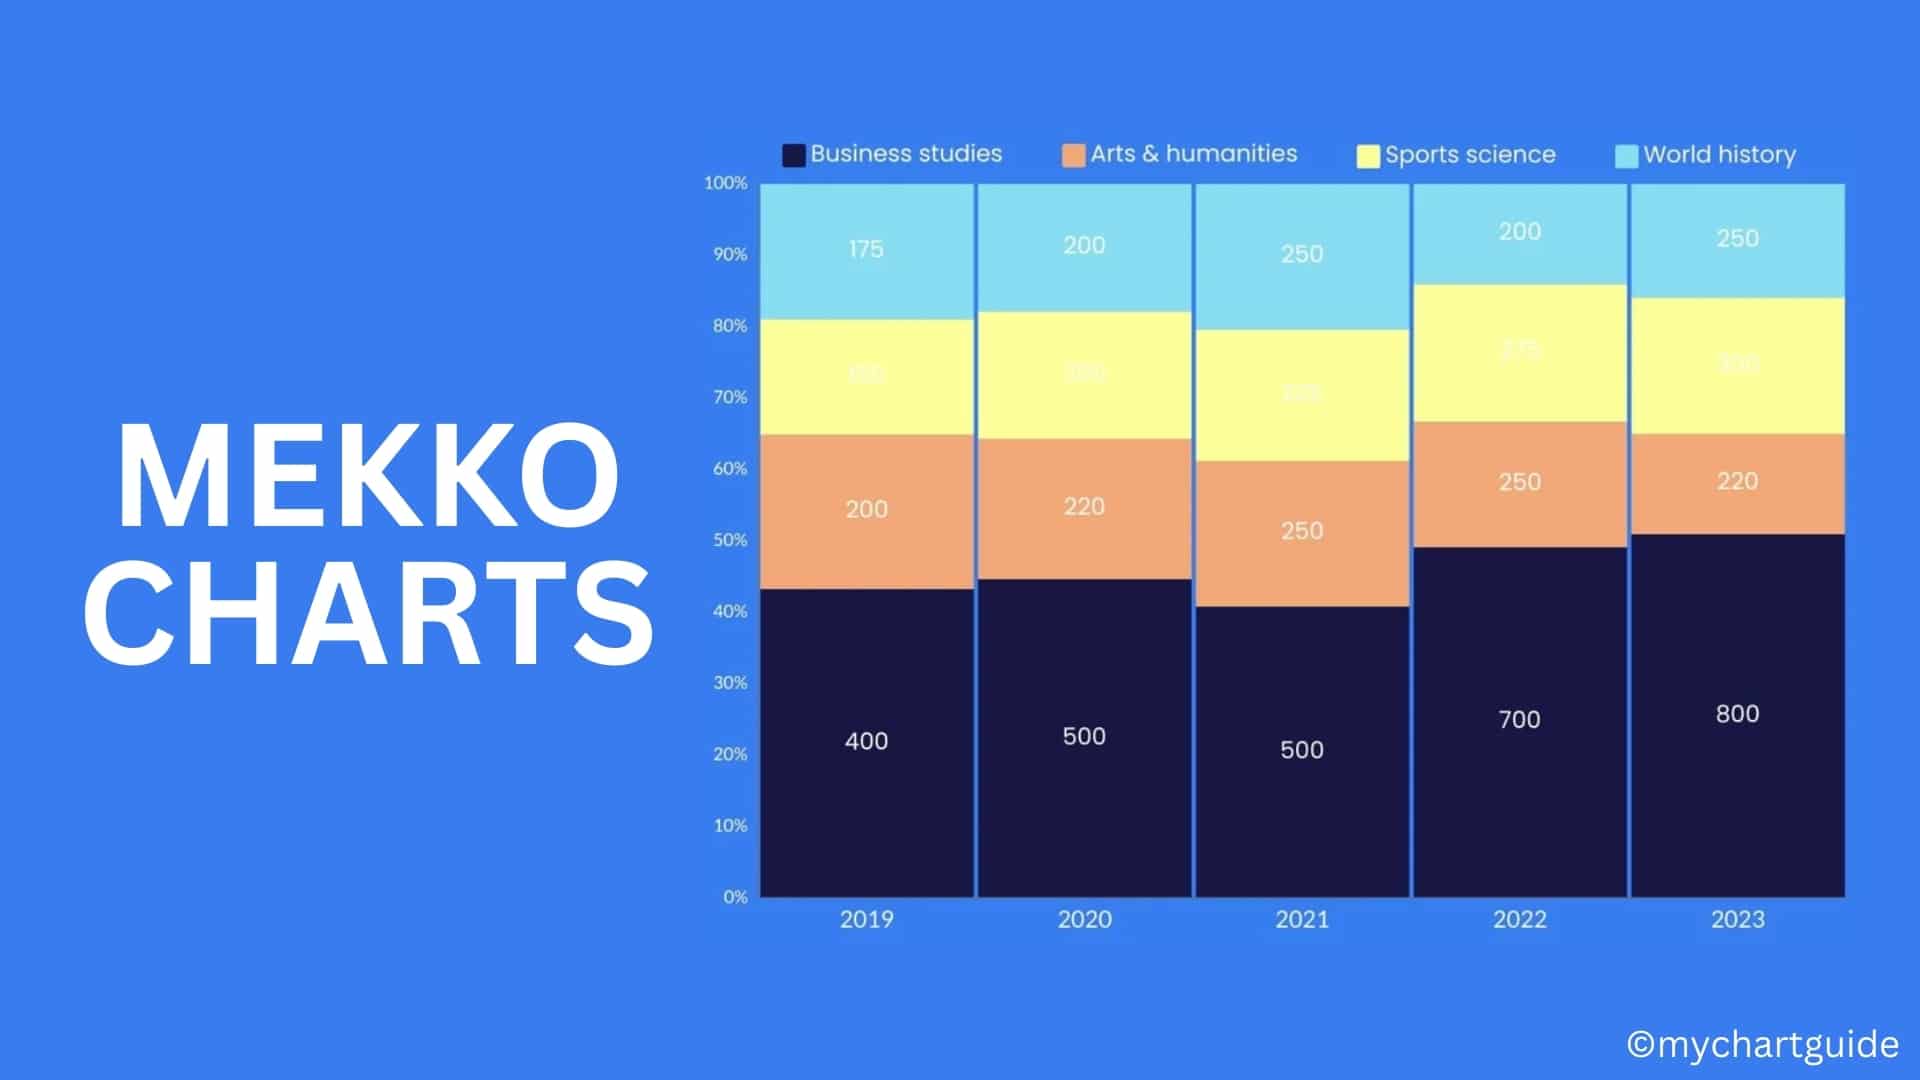
A Mekko Chart is a two-dimensional stacked bar chart where both the height and width of each bar vary based on the data it represents. Unlike traditional bar charts, which only compare one variable (height of the bar), a Mekko Chart displays two dimensions of data simultaneously:
- The height of each segment represents one measure (e.g., revenue share of a product).
- The width of each bar represents another measure (e.g., market size or time period).
This dual representation makes Mekko Charts especially powerful for showing how different categories contribute to a total, while also comparing their relative importance.
Mekko Charts are widely used in business consulting, market analysis, and strategic planning because they help visualize market share, product portfolio performance, and competitive landscapes in a single chart.
Key Features of Mekko Charts
- Variable Width Columns – Each bar’s width represents a proportional value (like market size or time span).
- Stacked Segments – Each bar is divided into colored segments showing different categories (e.g., competitors, regions).
- Percentage or Value Representation – Bars can display actual values or percentages for better comparison.
- Comparative Analysis – Allows quick insights into both distribution and relative importance across categories.
Types of Mekko Charts
There are different variations of Mekko Charts, each suited for specific purposes:
1. Standard Mekko Chart (Marimekko Chart)
- Shows both width and height variations.
- Useful for analyzing market share within markets of different sizes.
2. 100% Mekko Chart
- Widths vary, but heights are shown in percentages.
- Useful for comparing relative proportions across multiple categories.
3. Stacked Mekko Chart
- Focuses on stacking segments within bars but with variable widths.
- Ideal for showing contribution of different categories across uneven groups.
Uses of Mekko Charts
Mekko Charts are widely used across industries for analytical decision-making. Some key applications include:
1. Market Share Analysis
Companies use Mekko Charts to analyze market distribution across competitors. For instance, the width of bars may represent market size by country, while the stacked segments within each bar represent each competitor’s market share.
2. Product Portfolio Analysis
Helps visualize contribution of different products to total revenue across regions or categories.
3. Business Strategy & Consulting
Mekko Charts are a favorite tool in management consulting firms like BCG and McKinsey. They are used in growth-share matrices and strategy presentations to show which markets are worth investing in.
4. Sales & Revenue Breakdown
Visualizes how revenue is distributed across product lines, customer segments, or geographic locations.
5. Comparative Performance Analysis
Enables businesses to compare competitors and identify leading or lagging performers in a single chart.
Advantages of Mekko Charts
- Display two dimensions of data in one chart (height + width).
- Excellent for market analysis and segmentation.
- Easy to understand for executives and stakeholders.
- Highlights both proportions and distributions simultaneously.
Limitations of Mekko Charts
- Can be complex to create in standard tools like Excel.
- Hard to read if too many categories are included.
- Not suitable for showing trends over time (line charts are better for that).
- Labels may overlap if data points are too dense.
How to Create a Mekko Chart
Creating a Mekko Chart requires specialized charting tools since Excel does not support it natively. However, plugins and BI tools make it easier.
Step 1: Prepare Your Data
- List your categories (e.g., countries, competitors, or products).
- Assign values for bar width (e.g., total market size).
- Assign values for bar height segments (e.g., revenue share, product contribution).
Step 2: Choose a Visualization Tool
- Excel (with Mekko add-ins like Mekko Graphics or Think-Cell).
- Business Intelligence tools like Tableau, Power BI, or Qlik.
- Google Sheets (via third-party extensions).
Step 3: Create the Chart
- Define X-axis = categories with varying widths.
- Define Y-axis = percentages or values of segments within each category.
- Assign colors to different segments for clarity.
Step 4: Customize & Label
- Add data labels to each segment.
- Use consistent colors to represent the same category across bars.
- Add legends, titles, and notes for better understanding.
Best Practices for Mekko Charts
- Limit the number of categories – Too many bars make charts cluttered.
- Use contrasting colors – Helps differentiate stacked segments easily.
- Sort bars logically – By size, alphabetical order, or strategic importance.
- Highlight key insights – Use callouts or annotations to emphasize important findings.
- Avoid unnecessary complexity – Keep data storytelling clear and simple.
Example of Mekko Chart in Action
Imagine a company analyzing the global smartphone market.
- Bar width = Total smartphone sales in each region (Asia, Europe, North America).
- Bar segments = Sales share of each competitor (Apple, Samsung, Xiaomi, etc.).
This single chart can instantly show:
- Which regions dominate the market.
- Which competitor leads in each region.
- How market shares vary by geography.
Conclusion
Mekko Charts are a powerful tool for visualizing two-dimensional data distributions in a single chart. They provide deeper insights into market share, product performance, and business strategies compared to traditional charts.
While they may take some effort to create, the clarity and analytical value they bring make them indispensable for consultants, strategists, and business analysts.
If you want to present market data, competitor analysis, or portfolio breakdowns in a way that is visually impactful and easy to understand, Mekko Charts are the way to go.