If you have a corporate organization to run, chances are that you will need important insights on the same with relevance to the market standards. This is exactly what BCG or the Boston Consulting Group Matrix helps with. This corporate tool has been in practice for quite some time now and has helped companies grow and expand till no bounds.
For those who have heard about it but aren’t aware of the nitty-gritty behind the same, don’t worry because we got you covered.
Contents
What is the BCG Matrix?
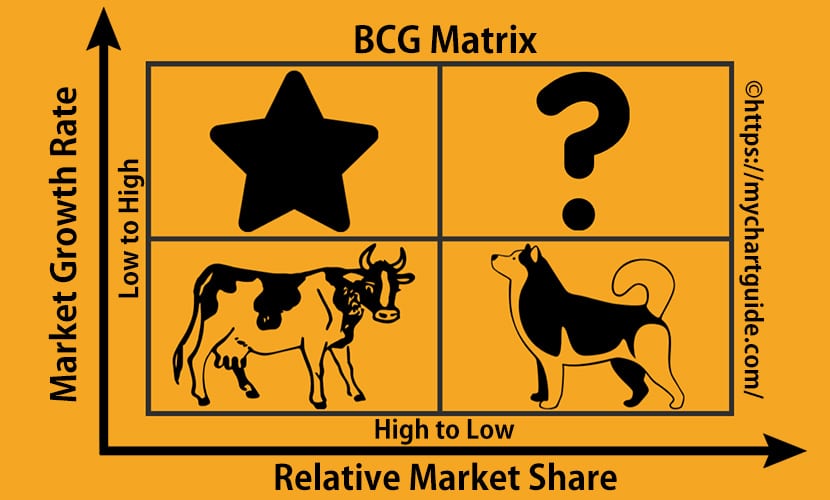
The Boston Consulting Group Matrix, also often termed as the BCG matrix is a popular corporate tool that is used for easy portrayal of the brand’s portfolio in the form of a quadrant representation. The horizontal axis depicts the relative market share axis while the vertical axis showcases the speed of market growth.
The main objective of this business tool is to be able to make use of the relative market share with the industry growth factors to further help in proper finding and evaluation of the portfolio of the brand along with better suggestion of the investment strategies involved in the said process.
If you aren’t aware of this tool at all, this has been developed to help businesses make informed decisions when it comes to the potential profits it could make in the market.
It has been further subdivided into four more categories based on two important factors including the relative market share and the growth rate of that same industry. These two factors combined help in determining the overall profitability of the business with respect to the cash needed for running the said unit and the kind of profit generated from it.
- You may like: Kanban Board: A tool to maximize work efficiency
It is believed that the primary reason why this matrix has been developed to help the corporate businesses understand the firms and the brands that are worth investing and the ones that are a hard pass.
What is the history like?
Before you know about the process of implementation and the associated, it is quite important that you have a fair share of knowledge about how the BCG matrix came into practice. As we did mention before, the process stemmed from the Boston Consulting Group which is a popular consulting firm. The company is known for their extensive business spread across 81 offices located in 45 countries.
It is this consulting firm and the owners of the firm that gave birth to the BCG matrix that is vehemently used by the marketers and the investors all across the world. Bruce D Henderson is the one behind the mastermind of the firm.
What are the two main influencing dimensions involved?
As we discussed earlier, apart from the quadrants, there are two primary factors that are involved in the process of evaluation of this matrix. These two factors play a key role in the progress of the overall process which is worth looking after.
The two factors involved include:
- Relative market share
- Market growth rate
Relative market share
For those unaware, it is a common factor that the higher market shares of the corporate results in better cash returns. The reason why that is the case is because the firm that is consistently indulging in more production and is benefiting from the heightened economy representing the scale and experience curve. But, there have been reports suggesting that there are some firms which do experience similar kinds of benefits with the lower production outputs as well.
Market growth rate
The next one on the list of components essential in the BCG Matrix is the market growth rate. This directly confers to higher earnings and better profits but in order to achieve that, one does need to indulge in more cash investments. The investment is the key that helps drive better growth for the firm or the brand in the long run.
What are the quadrants in the BCG matrix?
If you do want to get a better understanding of the things associated in this specific tool, it is a given that you further need to know what the four quadrants represent and the kind of significance that they hold.
In simpler words, the four quadrants do represent four different categories including:
- Dogs
- Cash cows
- Stars
- Question marks
Knowing each and every single one of these prospects does help in further knowing and understanding the prospects of the BCG matrix better.
Let us walk you through each and every single one of the prospects, shall we?
Dogs
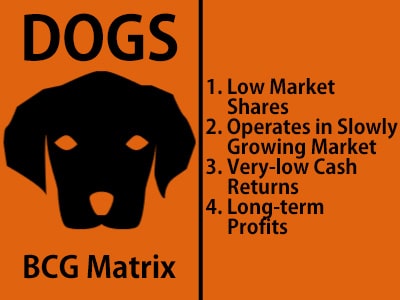
The very first one on the list is the dogs. They are the ones which have a low market share in comparison to the other competitors and do operate in quite a slowly growing market. The experts in this field suggest avoiding them for good, mainly because of the fact that they generate very low and negligible cash returns which are not worth the investment at all.
But, like a coin, everything has two sides to it. It is believed that there are a few of the dogs which can bring around profitable results in a long period of time and can even be responsible for providing synergies to other brands and organizations. Before making any kind of judgement, it is best that you do form a deeper analysis of each and every brand involved in the same.
Cash Cows

The next section of the quadrant includes the cash cows. They are considered to be the most profitable one and it is best considered that you do focus on milking their services, owing to the kind of benefits that they bring along. the experts suggest that its best to invest the earned cash from these organizations on the future growth of the brand. If you follow the basic strategy of the growth matrix, it suggests that it is quite important that one invest on the cash cows to not induce further growth but to help support them in the market at the current state of time.
They are often associated with big products and processes that later become new stars altogether. Their importance in the market is so impactful that it is believed that there wouldn’t have been any kind of innovation if the cash cows weren’t involved in the process.
Stars
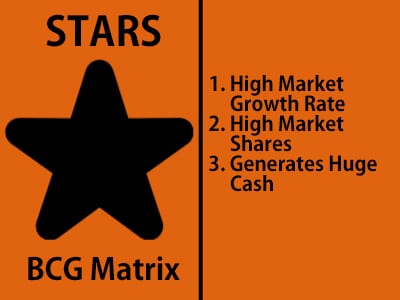
The next part of the quadrant is the stars which predominantly operate in the high growth industries and have high market shares as well. It is also stated that the stars are responsible for generating huge amounts of cash and at the same time, using them as well. Owing to the kind of potential that they have, the experts from the industry do suggest that one should invest in the stars because they are the precursor to the cash cows.
If you do experiencing rapidly changing industries that have the potential to get out-competed by the new technological innovations, there are possibilities that the star can downgrade to a dog instead of becoming a cash cow.
Question Marks
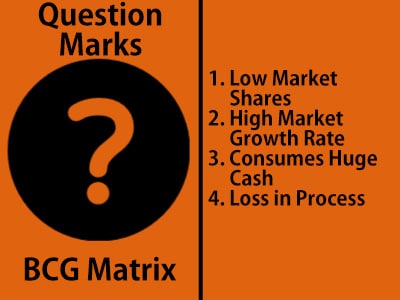
As weird as it might see like, question marks are the specific brands in the market that require further closer consideration. They have been found to be responsible for holding lower market shares for the varying fast growing markets. They tend to consume a large amount of cash and then end up experiencing losses in the process as well.
But, don’t judge it just yet, mainly because of the fact that they do have the potential to become a market star by gaining rapid shares. Reports have suggested saying that the question marks don’t always gain the success that people expect them to and there are possibilities that even with large amount of investments, they might fail to shine through. This is the reason why according to the BCG matrix, it is very important for one to indulge in close assessment before making the final investment.
How should one use the BCG Matrix?
When it comes to applying the BCG matrix to your firm, it is quite important that you know about the steps involved in the process. To be precise, there are five distinct steps involved that make the process worth witnessing around.
For the most part, these are the steps that make all the difference and can either gain you cash and profits like no other or end up leaving you in debts that you just can’t afford paying back.
To help you with the process, we are going to breakdown the five steps involved in the process.
Choose the unit
The very first stage of application that is worth noticing the kind of units that can be analyzed using the BCG matrix. The experts suggest that some of the units or niches that can actually be analyzed with the same include the strategic business units, individual brands, product lines or simply the firm as a whole. Once you have the unit chosen, it is that helps in driving the overall process in the correct direction.
Define the market
With the unit chosen, the next best thing that is worth exploring is the definition of the market. If you don’t know or realize the status of the market, chances are that the same will end up reflecting on the overall results in the long run. The incorrect understanding of the market leads to incorrect analysis and classification of the unit involved.
Calculate the Relative Market share
Owing to the fact how important relative market share is, it isn’t a surprise at all that you need to make the salient calculations of the same depending on the kind of unit that the same is related to. If you are wondering how to do that, it can be calculated by dividing the selected unit or brand’s market share by the revenues of the biggest competitor in the industry at the moment.
Calculate the Market Growth rate
The next thing on the agenda is to calculate the market growth rate which can be done so with the online industry reports. If that isn’t something that you can get a hold on, you can also get the market growth rate with the average revenue growth of some of the leading names in the industry. This is plotted against the y-axis for better recognition.
Draw circles on the matrix
The last step in the process is to draw circles on the matrix. Once you have all the measures plotted out, the next step is to finally get your hands on plotting everything and putting it out on the diagram. You can do so by drawing out individual circles for each of the brands involved within an unit or a company.
What are the advantages and disadvantages of the BCG matrix?
Much like any other prospect of charting and market analysis, even BCG Matrix does come with its fair share of pros and cons.
To help you make an informed decision and better judgement, we are going to list out all of the advantages and disadvantages of the BCG matrix that you need to know.
Advantages of BCG matrix
- Helps an easy process for the managers for evaluating the balance present in the company’s current portfolio.
- Suitable for larger companies on the lookout for the volume and experience effects.
- Very simple and easy to decipher with each step explained according to the needs.
- Provides a base for the future decisions to be made and implemented for the overall growth and development of the company in question.
- Following the matrix and the strategies helps the companies plan ahead with the manufacture and the selling of the products at a low but competitive price point for better returns.
Disadvantages of BCG Matrix
- Neglects the importance of the synergies present in between the several units in question.
- The outcomes with the predictions aren’t always foolproof and can end up changing depending on the situation of the market.
- The model and the strategies involved are all two dimensional, focusing on just two important factors and not delving deeper into the same.
- The model doesn’t emphasize the importance or the impacts on the small units and businesses and tends to neglect their impacts on the overall process.
With so many available possibilities and impacts that the BCG matrix has on the overall process of the organization, it isn’t surprising why this is such a coveted process involved in this. It helps the companies foresee better outcomes in the end to ensure maximum returns without any kind of negligence. It is a very commonly integrated process nowadays that majority of the brands are not adhering to.