Imagine, you are sitting in a Climatology Class. The Professor is lecturing using endless tables of Weather data. Obviously, all that data is going to fly over your head. Long tables and lists tend to be boring (for most people). Pictorial representations of data make it easier for the brain to comprehend large amounts of data and get a clearer understanding.
The credit for the invention of Charts goes to the Scottish Engineer and Economist, William Playfair, who used the graphical method of representation to show Business over time. He felt that the tables were too time- consuming and men of higher ranks only had to see a simple general outline of the data.

The type of chart used depends on how the information has to be conveyed. The different kinds of data that can be represented using charts include:
- The variance of one factor with respect to another, e.g. distance with time, profit/loss over years, temperature changes across the year, etc…
- To represent parts of a whole, e.g. a number of students learning different subjects in a classroom, votes taken from different groups, etc…
- Some charts, usually used in the field of science, have various parameters along the different axis. Lines are plotted according to certain instructions to obtain various values form the same chart. Example, Psychrometric chart, which used to calculate the air quantities and other requirements for Air Conditioning a space.
You may also like: Charts, Graphs and Diagrams – Importance, Applications and its Role in Life
Contents
Types of Charts
The type of chart used depends on how the data has to be represented. The following are the common types of Chart representations:
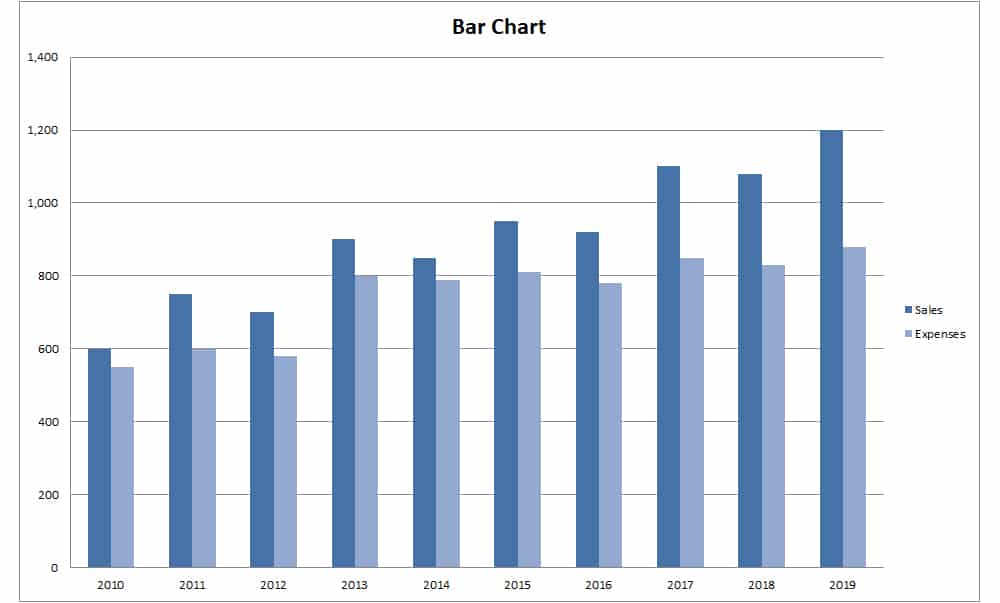
1. Bar Chart
This is most commonly seen and widely used type of graph. In a bar chart, the length of the rectangle/bar corresponds to the value it is representing. A bar chart can be drawn parallel to the x-axis or the y-axis. Data can be easily interpreted using a Bar chart, as the variation in height evidently shows the variation in the data.
2. Pie Chart
Pie charts, as the name suggests, shows data like different sized slices of a pie. The value is proportional to the size of the sector it corresponds to.
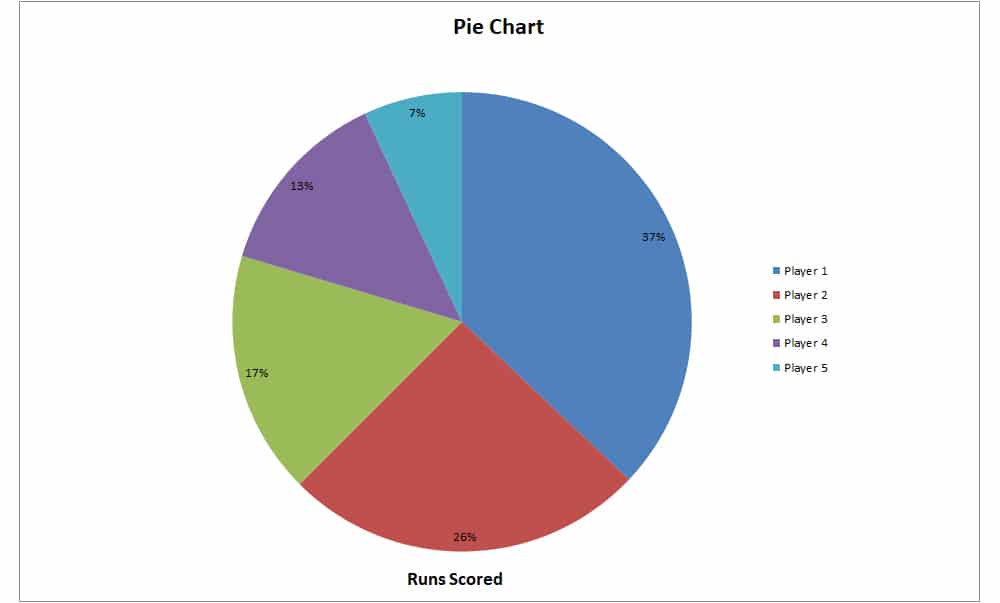
The easiest way to mark data on a pie chart is by finding out what angle the particular value corresponds to, with respect to the whole. This can be found using the formula:
Pie charts can be used for many purposes. For example, to show the monthly expenses in a household for different items, to show the population of different ethnic groups in a country, etc…
3. Histogram
A Histogram is used to represent data that varies with intervals. The width of the rectangle lies along the width of the interval. Thus, in a histogram, each rectangle lie adjacent to one- another without a gap in between. The difference between a Bar chart and a Histogram is that, in a Bar Chart, each rectangle corresponds to a value, whereas in a Histogram, each rectangle corresponds to an interval.
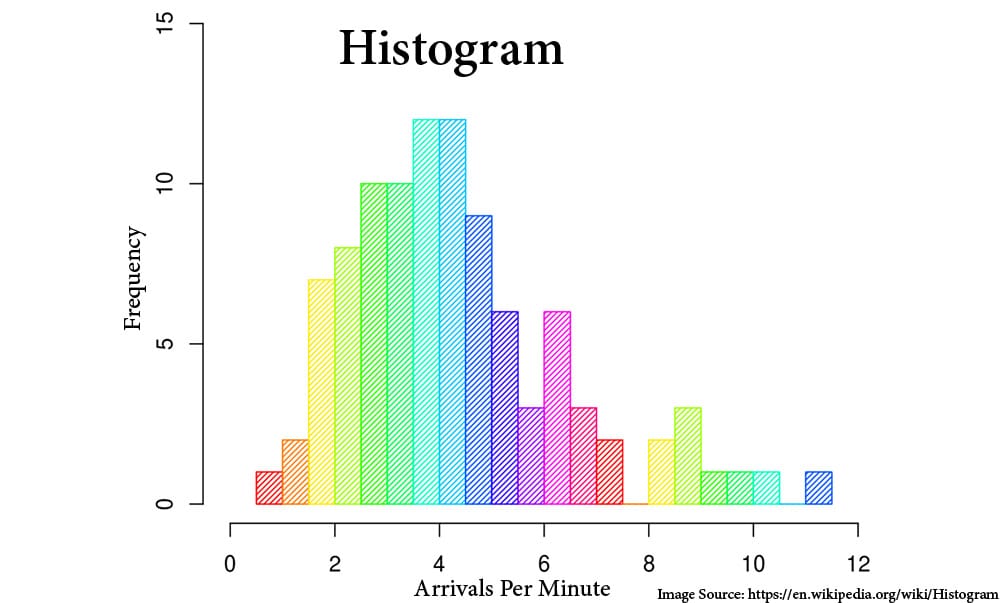
For example, to create a graph for the frequency of arrivals at an Airport in a day, a histogram can be very convenient. The intervals of time are marked on the x-axis and the number of arrivals on the y-axis. The bars are then drawn, to indicate the variation in frequencies through the day.
4. Line Chart
In a line chart, points are plotted with respect to the values along the x and y-axis. These points are then joined to form a line. The variance in the line lengths, the rises, and drops indicate the variation of the values with respect to each other. More than one line can be plotted in one graph to show the variation of different subjects with respect to the same parameters.
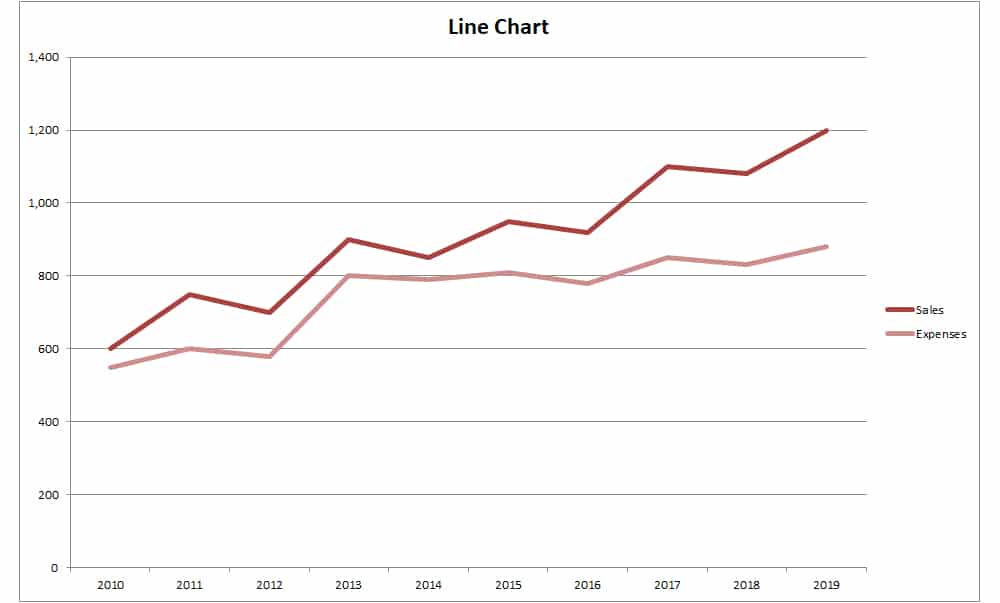
An example for line chart; a graph showing the variation in the population of different endangered species of animals across the world. The observed years will lie along the x-axis and the population number along the y-axis. The plotted line for each animal is marked in the same chart. To differentiate the plots, different colors can be used, or the name of the animal can be written above the line.
5. Area Chart
The area chart is similar to the line chart, except that, the gap between the line and the x-axis, or the line and the y-axis is colored. The area of this region gives a particular value. When there are multiple attributes to be plotted, each area is colored using different colors or hatched with different patterns to clearly differentiate between the areas.

A simple example can be taken from the 8th-grade Physics class. Plotting a distance versus time graph for a moving object, a line graph is obtained. The area between the plotted line and the axis gives the displacement of the object.
6. Bubble Chart
The chart contains two variables marked along the x and y-axis. Additional to this, a third variable is represented by the size of the bubble plotted inside. The bubbles are basically circular discs plotted within the quadrant. The size of the circle determines the value of the third variable.

For example, imagine a survey taken within a range of age groups, both men and women, to analyze the number of hours they watch TV. For tabulating this information into a chart, a bubble chart can be very efficient. The age group is plotted along the x-axis and the hours along the y-axis. The values for men are coded on color and the values for women another. The number of men and women are then indicated by the size of the circular disc, which is plotted with respect to the values on x and y-axis. The center of the circle is the plotted point and the radius varies with the number of men or women.
7. Scatter Plots
This type of charts is usually used when one subject is observed under the conditions of the two parameters along the x and y-axis. The values are plotted as dots in the quadrant. The plotted points could then form dense clusters or be distant. This will give an understanding of the frequency of the subject being observed.
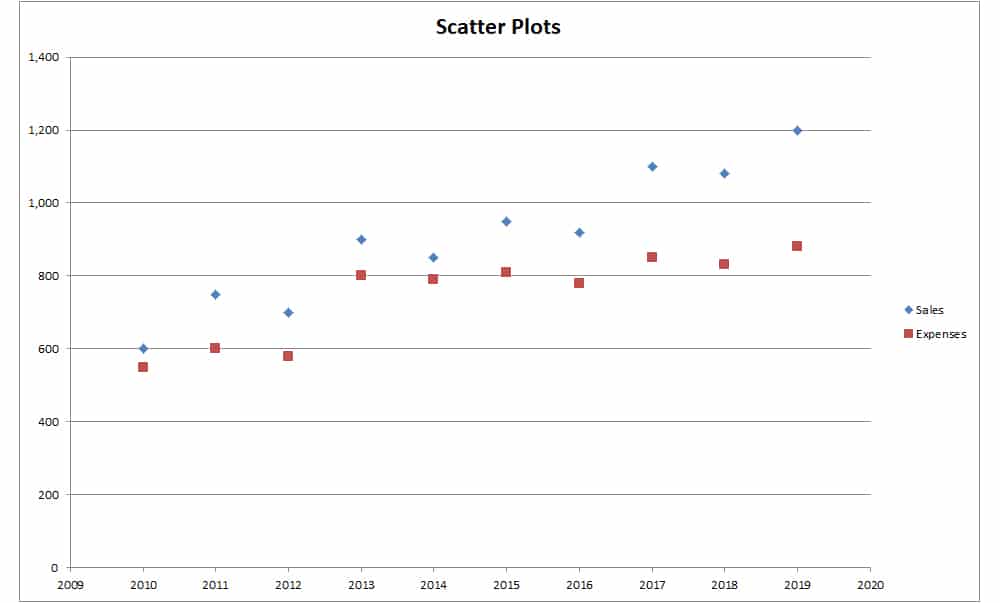
An example of the use of a cluster chart is for tracking the number of eruptions of an Active earthquake of a period of a Century. The Year of the eruption could be along one axis and the duration of eruption along the other. Each eruption is then plotted as a point. A pattern can then be observed in the extent and frequencies of the eruptions. These kinds of charts play a very important role in geological and weather observations.
Science of Charts
Representing data on Charts are very simple once it is figured out. There are two sets of parameters- one which is independent, and another which depends on the independent parameter. The independent parameter is usually marked on the x-axis and the dependent parameter lies on the y-axis. The label for each parameter is written below the corresponding axis. An arrow can be drawn to show the direction in which the value on the axis increases. The point of intersection of the two axes is the origin which has a value of 0.
If the axis has to begin at a value greater than 0, 40 for example, a kink is drawn right after the origin before marking the further values. This kink represents the missing numbers between 0 and 40. The scale of the values on each axis has to be mentioned alongside the chart. The scale refers to the intervals between the values on the axis. For example, if the values on the x-axis increases as 5, 10, 15, 20…, then the scale for x-axis is 5. Similarly, the scale has to be marked for the y-axis. The scale for the x and y-axis can be same or different.
The data points are then plotted within the quadrant. Depending on the values of the parameters, the quadrant in which the chart lies will also change.
- When both x and y-axis have positive values, the Chart will lie in the first quadrant.
- When x-axis has negative and y-axis has positive values, Chart lies in the 2nd quadrant.
- When both x and y-axis have negative values, the Chart lies in the 3rd quadrant.
- When x-axis has positive values and y-axis has negative values, the chart lies in the 4th quadrant.
Each point corresponds to a value on the x and y-axis. To read a chart, the plotted points are extended to the x and y-axis. When the point is extended with a line parallel to the y-axis to meet the x-axis, the value of the parameter along the x-axis is obtained. When the point is extended with a line parallel to the x-axis to meet the y-axis, the value of the parameter along the y-axis is obtained.
While working on paper, the easiest way to plot a graph is on a graph paper. These sheets have marked out grids, which makes marking of intervals much easier. Even plotting of points is easier, as you can move your pencil along the grid lines to trace the exact location of the point.
Digital Charts
Just like anything else on this planet, technology has made life far easier. In the case of Charts, different software offer tools to create legible and attractive charts. Software such as MS Word, MS Excel, allow easy creation of tables that can be converted to a chart of our choice. The tables can be edited later if needed, and the change will simultaneously be reflected in the chart. Creating a chart digitally has multiple benefits:
- Faster and simpler Chart making.
- Data can be edited later.
- Easy application of colors and designs.
- Charts created in one software can easily be exported to another software.
- Charts can be easily shared across the internet.
There is no question of legibility. Charts can be easily understood by anyone.
Steps for making a chart in MS Word

- Open a new MS Word Document and choose Blank Document.
- Go to Insert menu on the Menu Bar and click on Chart, under the Illustrations group.
- You will then see a tab, which asks you to make a choice of the type of chart you would like to create, from a list of charts. Let us make a Pie Chart for the given data.
- Upon choosing the type of chart, MS Word opens an Excel sheet automatically, to tabulate the given data. A sample chart will also be displayed. The values on the chart will be changed as the new values are entered on the Excel Sheet.
- Enter the values into the table. There is no limitation to the number of rows or column. Any number of rows and columns can be added.
- While entering the values in the table, it can be seen that the chart is getting modified simultaneously. Once all the values are entered correctly, the excel sheet can be simply closed.
- Double- clicking on the chart gives further edit options. A new Design tab becomes active, using which the design and layout of the chart can be edited. You can choose your chart to have solid color fill, gradient fill, or even modify your chart to 3D.
- To re-edit the data entered in the Excel sheet, Right click on the Chart, choose Edit data. This re-opens the excel sheet, allowing you to add data or make changes. The Edit Data option is also available in the Design ribbon.
- On double clicking the Chart, the design tab opens, which has a variety of Edit options.
- Add Chart Element- allows you to add or edit the different elements of the chart, such as the Title, Legend, and other details.
- Quick Layout- allows you to choose from a list of pre-set chart layout styles. Clicking on any one will automatically change the current chart style to the style chosen.
- Change Color- allows you to change the color palette followed for the chart.
- Change Chart type- allows you to change the type of chart, even after you have already created a particular type.
- Select Data- allows you to change the data range included in the chart
- Edit Data- allows you to make changes to the table entered for the chart in the excel sheet.
- The completed chart is inserted like an image in MS Word. In the Format tab, it can be edited and moved around, similar to how an image is edited in.
Steps for making a chart in MS Excel

- Creating a chart in Excel sheet is much efficient and simpler in MS Excel when compared to MS Word.
- Open a new MS Excel spreadsheet and choose Blank Workbook.
- Tabulate the data. Any number of columns and rows can be added.
- Select the entire table.
- After choosing the table, go to the Insert menu on the Menu Bar and move to the Charts group.
- Then simply select the type of chart you would like to create. Excel automatically creates the chart and inserts it on the excel sheet.
- Upon inserting the chart, Excel automatically activates the Design ribbon, which offers the same design edit options as in MS Word.
- The Format ribbon allows editing the font and chart outlines and colors. Other features that can be edited include line weight, highlights, shadow, shape fill, and much more.
- On clicking outside the chart anywhere on the excel sheet, the chart is complete and the edit options are temporarily closed.
- The edit options are reactivated when the chart is clicked on.
The benefit of creating a Chart in an Excel sheet is that MS Excel allows to add formulas and do calculations within itself. This makes entry of values easier when the table involves large numbers of calculations and formulas. Each row and column can be allotted a formula that links another row or column so that any value to be entered to it is automatically calculated. MS Word is convenient when the Chart is part of a bigger Word document, wherein, it can be edited like it’s another element in the Word Document.

Once the chart is complete, the file can be saved in the desired location in the .doc format. The format can be changed while saving the document into other formats such as PDF and many other formats.
Other Software
If you wish to make your charts more attractive and creative, they can be exported to design software such as Photoshop or InDesign. These software will allow you to add more decorative features to your chart, such as images, textures, a variety of color gradients, depth, etc.
Charts are an excellent mode of communication of large amounts of data. It clearly shows the relationship between different values. Being a pictorial representation, it lets readers memorize information better and with more understanding. Various software allows to create charts and has made the process much easier and fun with a variety of tools and edit options.