Line graphs remain one of the most effective tools for showing trends, patterns, and changes over time. Whether you’re comparing sales growth month-over-month or visualizing temperature data over a decade, line charts offer a sleek, easy-to-read solution that brings clarity to fluctuations.
But in 2025, the best line graph makers go far beyond basic spreadsheet plotting. They offer features like real-time data syncing, interactive elements, responsive designs, and high-quality export formats that serve both analysts and visual content creators. These tools also cater to non-designers with intuitive interfaces and ready-made templates.
In this roundup, we’ve selected the best line chart tools for 2025 that help users—from students and researchers to executives—turn raw data into compelling visuals. Whether you’re preparing a report, presentation, or dashboard, these tools make it easier to communicate data with impact and accuracy.
1. Visme – One of the Best Line Graph Makers of 2025
Visme continues to shine in 2025 as a top-tier line graph maker for professionals, students, marketers, and data storytellers.
With its sleek design interface and robust customization features, Visme makes it simple to convert raw data into stunning, easy-to-understand line graphs—no design or coding experience required.
Key Features of Visme as a Line Graph Maker:
- Premade Templates: Start with beautifully designed line graph templates tailored for various use cases.
- Fully Customizable Design: Edit everything from progression lines, axis, values, and background to animations and hover effects.
- Flexible Graph Types: Create single, stacked, angled, step, or smooth line graphs.
- Data Input Made Simple: Easily input data to bring your graph to life with color-coded points and trendlines.
- Brand Integration: Upload your brand’s fonts and color palette for seamless consistency.
- Visual Enhancements: Access millions of stock photos, icons, and the ability to add background images and color overlays.
- Download & Sharing Options: Export graphs as PDF, image, or embed directly on your website.
Pros:
- Intuitive drag-and-drop interface suitable for non-designers
- Gorgeous, customizable templates that speed up graph creation
- Smooth sharing and embedding features
- Excellent branding capabilities
- Suitable for interactive reports, presentations, and websites
Cons:
- Some advanced features are limited to premium plans
- May be overpowered for those needing only very basic charting tools
If you’re looking for a flexible and design-forward line graph maker in 2025, Visme stands out as one of the best. It combines simplicity, power, and beauty—perfect for turning complex data into clear, engaging visuals for any audience.
2. Edraw Max – Best Line Graph Software
In order to offer advanced features and charting symbols to users for curating interactive line graphs, Edraw Max is an online charting software that offers simplicity of use.
Besides rendering customization benefits, this all-in-one line making tool is also a vital resource and time saver.
It has thus gained the trust of nearly 25 million users as well as leading brands for the visualization, innovation and collaboration of a diverse spread of charts.
Other than just simplifying the visual workflow, this platform is highly in use for delivering better results given its Microsoft-like interfaces, professional template resources and drag and drop functionalities.
Also, this software makes sharing and teamwork easy on any shareable channel as it offers proper planning and keeps all the data on the same page during all times and places.
Pros:
- Easy to use features
- Contains 280+ types of line graph diagrams
- Unlimited templates
- Compatible with Windows, macOS and Linux
Cons:
- Contains heavy technical features
- Large file size
3. Vizzlo
Prompting its users in coming up with beautiful looking graphs for Google Slides and Powerpoint in a matter of seconds, Vizzlo is a one-stop solution you can run into to furnish attractive and impact rendering line charts.
Priced at affordable monthly and annual subscription plans, along with offering a free trial start to professionals, teams and enterprises in making charts, this online platform helps users in enhancing their productivity.
Owing to its robust configuration features and interactive interface, Vizzlo can be addressed as one of the best line graph maker for use in 2025.
Along with witnessing massive deployment among a herd of users spanning from beginners to experts, Vizzlo has made a place for itself in companies, such as IBM, Sanofi, Adidas, and Uber among a bunch of others.
This is mainly attributable to the impressive visualizations that it provides its audiences apart from the easily customizable line charts.
Pros:
- Stylish and aesthetic design tools
- Easy UI
- Simple and fast functionalities
- Basic version contains diverse features
Cons:
- All projects are public and accessible to anyone
- Lacks data organization tools
4. Piktochart
If you are tired of lacking data visualization of all your metrics, Piktochart is the ideal tool you need to add to your list of data organization.
It is easy to understand and takes a few minutes to translate your written data sets into a visual graph.
With easy integration features, users can link Piktochart with Microsoft Excel or Google Sheets for easy data extraction and update. You can easily combine multiple charts to better visualize your data and make it look sleek and professional.
Featuring custom color palette and easy access to branding tools, you can create line graphs for your data with the essence of your company’s branding. Also, Piktochart supports a multitude of templates that allow you to create different types of graph charts in no time.
Also, Piktochart comes with data organization tools that allow you to create individual folders to organize all your graphs and charts in one place for future reference.
Pros:
- Easy to use and navigate
- Hundreds of professional templates
- Library of graphics and images
- Easy integration tools
Cons:
- Branding of the tool appears in the bottom
- Basic free version isn’t great
5. Fotor

With how popular and significant line graphs are, it isn’t surprising that finding a good free online line graph maker can be a challenge.
Among them, Fotor is a leading platform that translates your data into a graphical format in no time at all.
Integrated with rich templates and design elements, creating a line graph takes minutes to create. Irrespective of whether you are a beginner or a professional, the pre-designed templates are here to help you customize and streamline your relevant data.
With the “Edit Chart Data”, organizing your data is no hassle at all. Users can import your local data and translate that into a graph in no time at all. Another benefit that deserves a mention is that inserting line charts into presentations, reports and infographics is fairly simple.
What’s great about Fotor is the multi-benefit layout. This means that not only can you create line graphs using this software, it can be used to create a variety of other diagrams, including pie charts and bar charts and in no time at all.
All you have to do is enter your relevant data and this comprehensive software enable you to create the beautiful line chart in no time at all.
Pros:
- Extensive range of templates
- Easy user interface
- Multi-purpose use for diagram creation
- Custom project dimension
Cons:
- Limited editing functions
- Upgrade to premium is necessary for more features
6. Adobe Express
When it comes to Line Graph makers, there’s nothing that can beat Adobe Express.
It is a leading data visualization tool that has been dominating the market for years now.
This free online graph maker allows you to create enticing graphs in a matter of minutes and save them forever for future use.
Besides supporting dynamic changes to the data and appearance of the graph, one thing that sets out in Adobe Express is the availability of different templates, which make using Adobe a lot easier and hassle free. You get to prioritize customization and better align the final graph based on the company’s branding.
Backed with an app, Adobe Express is an accessible line graph maker you can use anywhere and anytime. Furthermore, the accuracy of the created line graphs is precise and stunning and doesn’t even give away the fact that it takes users hardly a few minutes to sort through.
Pros:
- Free access to Adobe fonts
- Comes with 100GB of cloud storage
- Professional and customizable templates
- Accessible on web and mobile
Cons:
- Lacks SVG support
- Laggy performance
7. Venngage
Venngage is a well-known online tool when it comes to creating impactful charts with a touch of data integration.
On account of its beautifully designed and easy-to-edit templates, this freely accessible application has made a mark for itself across 40,000 businesses to assist them in visualizing their complicated data with ease.
In addition to this, what makes Venngage truly unique is its real-time team collaboration and assistance in easily importing data from Google and Excel Sheets.
Also, the line chart making process in this application comprises 5 basic steps that revolve around choosing the preferred templates, adding in the data, customizing the charts with colours, and sharing the resulting graphs.
Another feature that stands out for Venngage is the presence of My Brand Kit that lets you fill in the brand colours, logos and fonts through a click. The tool also houses a vast library of free icons and illustrations.
Pros:
- Easy to use features
- Quick processing
- Professional templates
- Free trial version available
Cons:
- UI is a little laggy
- Collaboration is challenging
8. Canva

Canva is undoubtedly one of the highly recommended online tools for making line charts given that it comes at zero cost to its users alongside offering an assorted range of subscription plans.
This application not only deals with beginner-level chart making but is also best suited for crafting and designing some of the most complex graphics with basic drag-and-drop functions.
One needs to simply insert the data through the “Data” button present on the toolbar, followed by a touch of personalization that reflects on the brand colors, fonts, and the insertion of data labels.
Another striking characteristic of this tool is that it ensures that the graph is in the same colour scheme as the rest of the document to make the line charts more compelling to the viewer.
In addition, once done, one can also publish, download or share the high-resolution graphs, or embed them in presentations, and reports.
Pros:
- Free version is quite enriching
- Easy to use UI
- Diverse range of templates
- Beginner-friendly
Cons:
- Cannot create unique elements
- Lacks photo editing tools
9. Displayr

Giving its registered users the perks of easy chart making and designing, Displayr has emerged as one of the highly used platforms for coming up with line charts.
Considering its free access to the general public and its reasonable pricing for professionals and enterprises, this web browser-based portal packs a range of options for its users to help them quickly create free line charts.
Apart from offering robust data collaboration and visualization capabilities, Displayr is known for crafting a diverse range of charts in just 3 basic steps.
All one needs to do is input the data values in the tables present at the interface. Once the line graph pops up on the screen, you can easily customize the graph with a personal touch of fonts, backgrounds, colors, and sizes.
Following this, one is free to share the charts or export them as images or PDF files with a click.
Pros:
- Thorough data visualization tools
- Aesthetic and customizable templates
- Easy user interface
- Basic plan is not bad
Cons:
- Runs on Java and R code
- Memory intensive tool
10. RapidTables – FREE Line Graph Maker
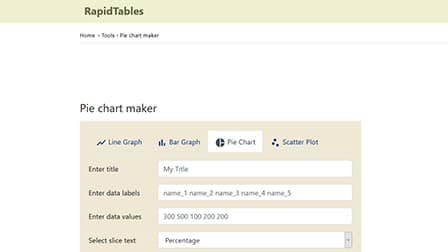
RapidTables has emerged as an instant solution to all its users in order to furnish and design a diverse range of charts in a jiffy.
Although this online application mostly works around a lot of numerical and statistical data, it supports the creation of various graphical structures, including tables, and charts with internal calculations and conversions.
On account of its untangled and simplified interface, this web-accessed platform has been highly adopted by millions of users across the globe.
Apart from its pop-up box like chart making workspace, what makes RapidTables stand out is the ease of structuring of the line charts that it gives its users.
All one needs to do in this application is manually input all the data to place them across both the axes, along with specifying a few other parameters. Post this, the line charts appear on the screen, for further resizing, sharing, downloading and printing.
Pros:
- Simple and effortless functions
- Multiple pre-made templates
- Professional data visualization tools
- Minimal UI
Cons:
- Lacks advanced features
- Very basic designs
You may like:
- 10 Best Bar Chart Maker
- 10 Best Pie Chart Maker
- Top 10 Best Flowchart Maker
- 10 Best Venn Diagram Maker
- Top 10 Best Infographics Maker Tools
Verdict
To put briefly, the above-mentioned line chart making software and tools are not only powered with interactive and easy to use interfaces but are also packed with a bountiful of templates to offer effortless working.
Additionally, as these chart maker are configured with various advanced settings and functions for the customization of graphs, they are largely deployed for enhancing the line charts for more simplification of user work.
Ascribing to this, these portals have garnered a lot of popularity across a gamut of corporate and designing verticals to cater to the needs of easy chart making.
Edraw Max, Visme and Canva, on account of their dragging and dropping functionalities and the access to a wide range of enhancing elements, are marking extensive preference by individuals.
Adobe Express, Displayr and RapidTables have gained an incredible reputation for the simplified chart making process they provide to their users.
While Vizzlo is best-known for its affordable subscription plans and robust visualization, Venngage offers its esteemed users the benefits of team collaboration in real-time.