Skip to content
My Chart Guide
  • Charts
  • Graphs
  • Diagrams
  • Reviews
  • Best of Best
  • Tutorials

Diagrams

What are network diagrams, and why do you need them?

On September 15, 2023 by Vishwjeet Singh Chandrawat

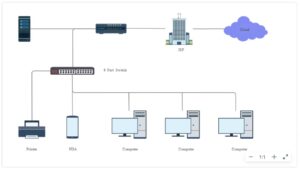
Networks are the backbone of our digital world. Whether the internet powering our online shopping spree or the complex web of connections running the corporate offices, they all rely on networks. But you may wonder how all these connections are organized and visualized in an easy manner as they don’t look so simple to comprehend … Read more

Categories Diagrams Leave a comment

Place Setting Diagram: Know about the details and the Etiquettes

On April 8, 2022 by Ann Hill
place setting diagram

A place setting diagram helps in better understanding of the things surrounding the table settings in an event. It helps draw an outline of the elements to include based on the food to be catered.

Categories Diagrams Leave a comment

Database Design – Everything one needs to know

On August 9, 2021 by Ann Hill
database designing

For those who aren’t aware of the basics surrounding this, a database design is one where you categorize and represent the collected data in a graphical form with charts and diagrams.

Categories Diagrams Leave a comment

Swimlane Diagram – Know Everything About It

On April 20, 2021 by Ann Hill
swimlane diagram

Swimlane or swim lane diagram is a popular flowchart based diagramming that helps in recollecting the entire process involved in a project from start to finish.

Categories Diagrams Leave a comment

Deployment Diagram: Everything that you need to know

On December 18, 2020 by Ann Hill
deployment diagram

In terms of UML, Deployment Diagrams are predominantly used to visualize the processes involved with the hardware and software and the way the two does interact and perform.

Categories Diagrams Leave a comment

ArchiMate: A quintessential for all architectures

On October 1, 2020 by Ann Hill
ArchiMate

ArchiMate is a diagramming tool targeted to help support architectures in drawing better visual representation of their ideas and thoughts with a unique modelling language.

Categories Diagrams Leave a comment

Fault Tree Analysis (FTA): Know where the loophole is

On September 16, 2020 by Ann Hill
fault tree analysis

Fault Tree Analysis is a type of diagrammatic representation which helps find the loopholes in the system to further minimise the errors and find alternative ways to cope with the same.

Categories Diagrams Leave a comment

What is a Venn Diagram?

On July 4, 2020 by Zachary Velazquez
Venn Diagrams Explained

Venn diagram is a pictorial representation of logical or mathematical sets in form of circles. The intersection of circles shows the common elements of two or more sets.

Categories Diagrams Leave a comment

What is a Rack Diagram?

On April 25, 2020 by Zachary Velazquez
Rack Diagram

A rack is a frame used to organize and hold various hardware devices. And a rack diagram is a graphical presentation of such rack system.

Categories Diagrams Leave a comment

UML Class Diagrams – Definition, Attributes, Benefits and Process

On March 20, 2020 by Ann Hill
UML Class Diagram

Class diagrams are the building blocks in an object-oriented model that helps establish correlations and the relationships between varying objects in the same system.

Categories Diagrams Leave a comment
Older posts
Page1 Page2 Next →

Best Tools

  1. Best Project Management Software
  2. Best Gantt Chart Makers
  3. Best Infographics Makers
  4. Best Flowchart Makers
  5. Best Venn Diagram Makers
© 2025 - My Chart Guide
Next Page »