Lucidchart is a powerful visual software with amazing features to draw diagrams, visualize data and collaborate with your team. It is very easy to use and bends to your workflow. And beyond being just a technology, Lucidchart offers resources to help users grasp the concept of diagramming and data visualization. If you are new to diagramming, Lucidchart will ease your entry into the amazing visual world.
Contents
What is Lucidchart?
Lucidchart is a web-based software used for diagramming, data visualization, and team collaboration.
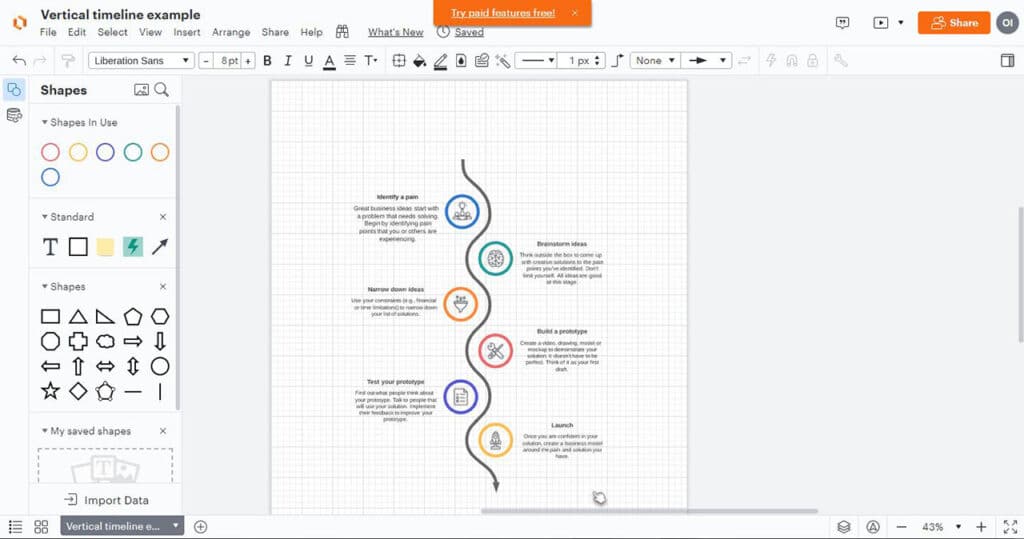
For diagrams, Lucidchart offers many visual tools to allow you to draw a visual representation of an idea or process and share it with your team.
Yes, you can use Lucidchart to map out the process flow of a project, teams, plants, etc.
Also, Lucidchart is equally useful for data visualization. Yes, you can give visual representations of your complex data. Lucidchart offers elements (e.g. graphs, charts, maps, etc) to help you represent your reports with stunning visuals so stakeholders can analyze and interpret your reports to look out for trends, outliers and make actionable decisions. You can also import your data from spreadsheets and give visuals.
With Lucidchart, you can also collaborate with your team. And this applies to teams across different departments. IT, marketing, sales, engineering, etc. With Lucidchart, you can draw the process flow of a project. So that every team member clearly understands the steps to be taken to complete a particular project. And, of course, it is clear cut who completes certain tasks.
Pros
- In-app tutorials to help you get started easy
- Intuitive interface
- Easy to use
Cons
- Can’t create multiple workspaces
- Flow arrows are not easily adjustable
Pricing
Lucidchart has four pricing tiers. This includes the free plan, individual plan, team plan, and enterprise plan.
Of course, the free plan is as free as it gets. Without paying a dollar for Lucidchart, you can edit 3 documents, you can choose from 100 pre-existing templates to create very good flow diagrams. And, of course, you can collaborate, you know, give permissions. Just something basic. Also, you can integrate a few apps with Lucidchart.
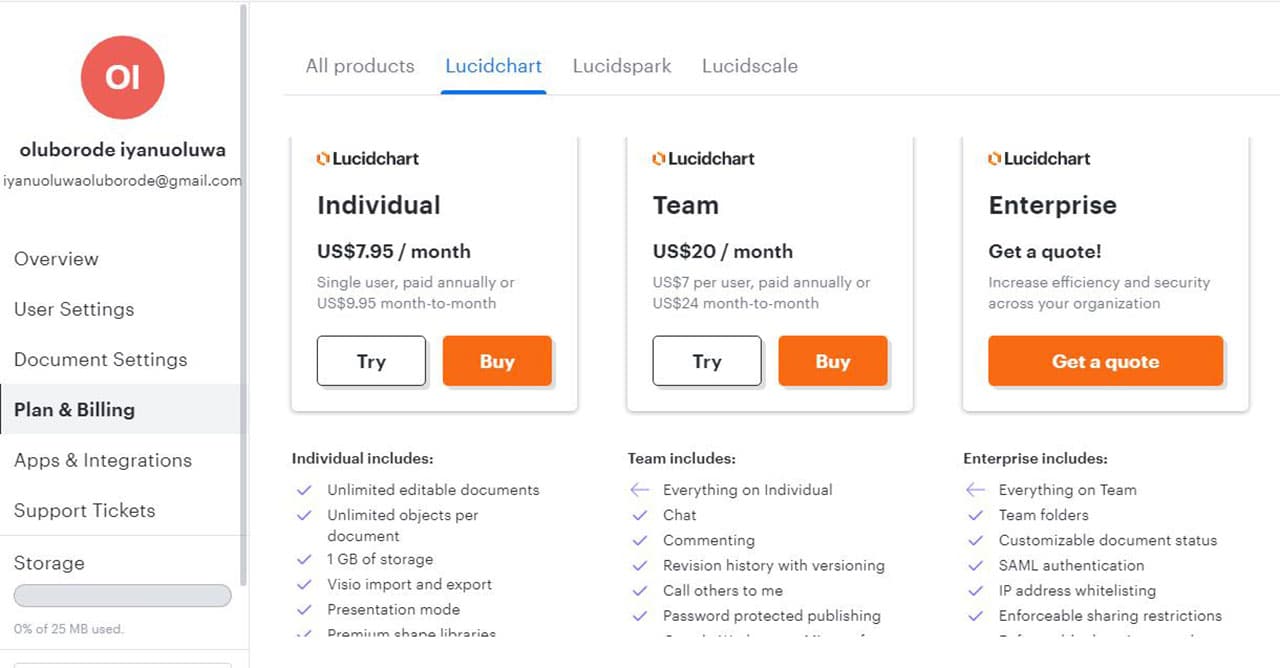
The individual plan costs $7.95 and is a good fit for an individual. Now, this does not mean you cannot collaborate with teams. Yes, you can collaborate with people on projects like you can with the free plan.
However, you are the only user on that account. Also, you have access to 1000+ pre-existing templates. You can take on unlimited documents of Lucidchart at the same time. And you can integrate some other enterprise apps with your software.
Now the team plan costs $6.67 per user and you must have a minimum of 3 users. I think that’s a fair deal. Of course, if you just use Lucidchart for one department in your organization, this plan might be a good fit for you.
You can work on unlimited documents. And you have access to over 1000 pre-existing templates available on Lucidchart. And you have advanced collaboration and integration features. Plus easy admin control.
Now, like most SaaS businesses, Lucidchart does not disclose the price of its enterprise plan. So you have to request a quote from the sales team to find out. Of course, with the premium plan, you have access to all the features Lucidchart offers. Unlimited documents, unlimited users, SSO login, advanced integration, and collaboration features.
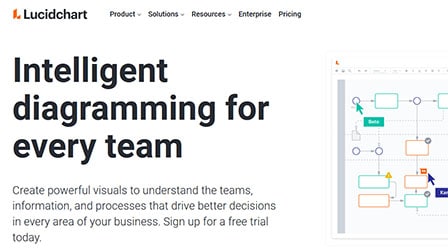
The interface
Lucidchart has a pretty intuitive interface. The layout is nothing complex compared to all the complex work on the software. Of course, the design is quite beautiful with one distinct color.
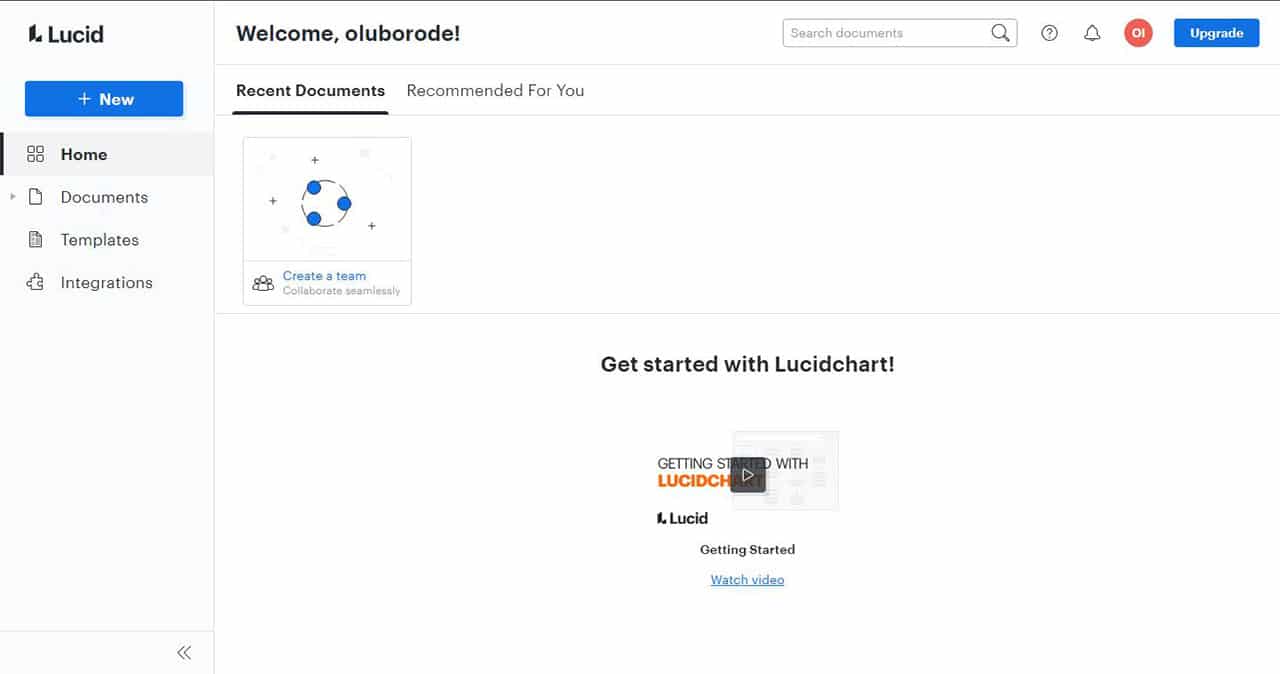
The dashboard has a side panel with items, like documents, templates, home, and integrations. And on the right side, you have an education center that offers materials to help get started. On this panel, you can see what is new on Lucidchart and tutorials to get started with Lucidchart as a beginner.
When you open a document in your workspace. You have a canvas and side panels. On the left panel, you can choose templates, documents, and adjust settings. Now, there’s a menu bar just like you have on your Microsoft word. Basically, on the menu bar, you can perform a couple of operations like changing the view of your canvas, arranging elements on your canvas, and more.
Lucidchart is primarily a web-based application. But you can uninstall the app on Mac, desktop, and Linux. Also, Lucidchart was designed for mobile (iOS and android) so you can work from anywhere and sync automatically with the web program.
Yes, you can visualize and edit diagrams on the go. And Lucidchart takes it a step further by allowing you to edit your offline. So you are staying productive even if you don’t have access to an internet connection.
The mobile app, of course, has fewer functionalities compared to the desktop app, but it is super-responsive. You can move your canvas around and zoom in or out to have a different view of your diagram. And, of course, you can drop elements from the library onto the canvas.
And if you like dark mode as I do, it would please you to know that Lucidchart mobile is in a dark mode by default. However, you cannot switch between dark and light views. This is quite understandable, considering a light view might conflict with your canvas on a small screen.
Integration
Lucidchart integrates with some of your enterprise apps so you don’t get lost in disjointed data. Although some of these integrations are restricted to specific accounts. And especially now that many teams are working remotely, Lucid chart allows the flexibility of integrating with some collaboration and productivity tools including slack, Microsoft teams, google drive, Asana.
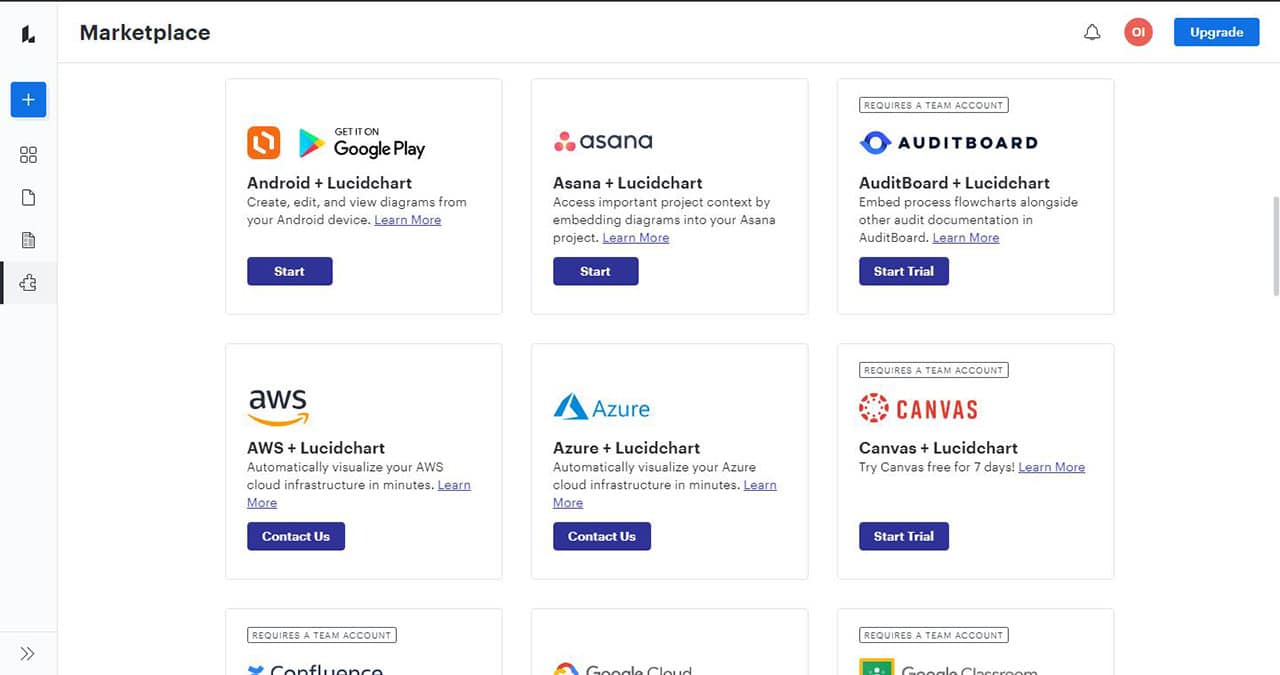
Lucidchart integrates with slack, so you create diagrams directly from your slack account without going back and forth from Lucidchart to slack. Considering that many teams use slack for collaboration, this integration will ease a lot of team collaboration.
So you easily collaborate on diagrams and flows with your team. Now, this integration goes for Asana and Microsoft teams. directly on that software, you can create and share diagrams with your teams.
Some of the other apps you can integrate with LucidSpark include AWS, Azure, Google Docs, etc.
How to get started
To get started with Lucidchart, you simply need to go to the website and sign up with your work email. Yes, Lucidchart accepts Gmail. So don’t stress if you are an individual seeking to get some work done. Once you sign up, Lucidchart takes you to a simple dashboard.
On this dashboard, they present you with some tutorial videos to help you get started easily with the Lucidchart. However, Lucidchart does not limit your options. On the left panel (the education bar) you can choose to read articles or contact the Lucidchart help center if you need extra help.
Now, on the right side, you can choose a button to create a new document. You either start from scratch, import from other diagramming programs (Iike Visio, Gliffy, Draw.io, and Omnigraffle), or choose from one of the pre-existing templates on Lucidchart. Lucidchart has a variety of templates, from flowcharts, database diagrams to system diagrams, process flow, to wireframes.
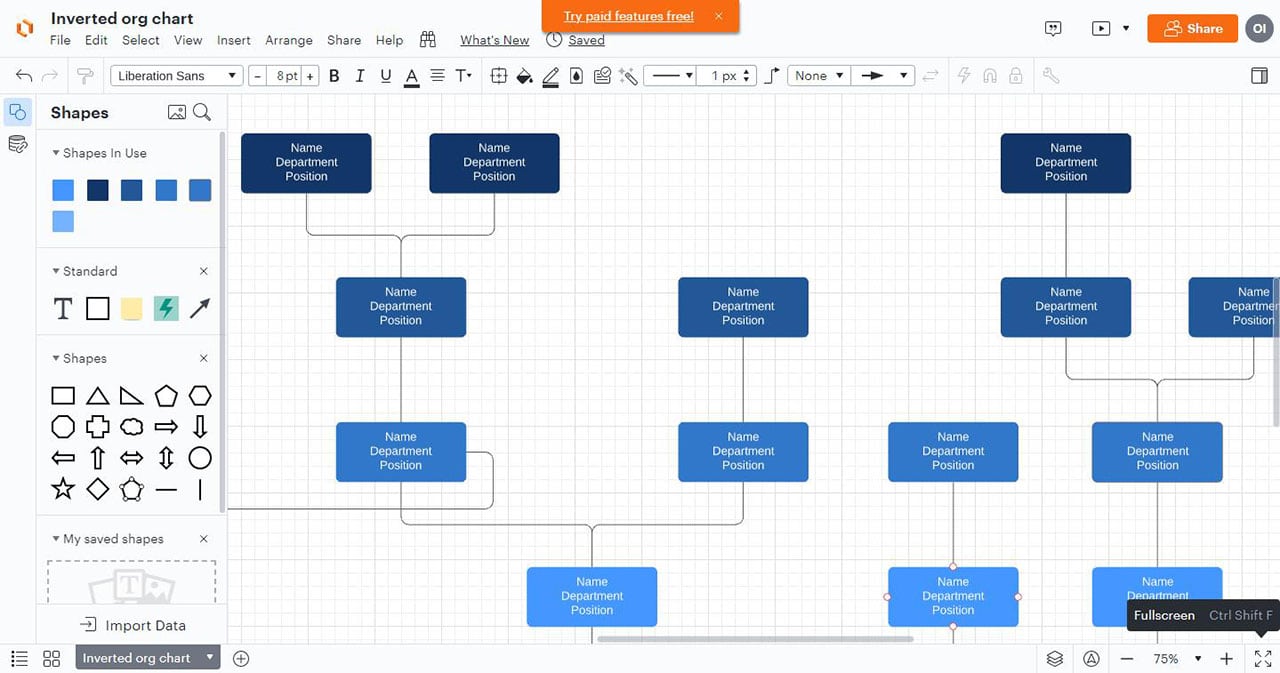
Now once you once create a new document, Lucidchart directs you to a workplace. If you are creating for the first time, you get pop-up guides to help you navigate your way through Lucidchart. Now the workplace is not complex. It’s a side panel, a canvas, and a right-side panel. And of course, a 2 tier menu bar at the top to perform certain actions.
Now the main canvas where you draw your diagrams has a grid line you can customize according to your taste. You can change the color of the canvas, the unit of measurement, and also opt for an infinite canvas. There’s more you can do, like the page size, orientation, and scare your content to container size. And also decide not to have grid lines.
Now, on the right-hand side of the workspace, you can drag and drop the element (shapes, flowchart symbols, notes, images, icons, etc) onto your canvas. Of course, you can adjust these shapes on your canvas. And Lucidchart shows you the dimension of your shape as you adjust.
Now on the menu bar directly below the title bar, you can input certain instructions as you would on Microsoft word. Yes, you can select how to view your diagrams, arrange your diagrams. And my favorite function is the “find and use” feature. The icon is the shape of a binocular on the menu bar.
Collaboration
Lucidchart allows you to collaborate with your teams on diagramming, flow-charting. You can share your document and give permissions to either view, comment, or edit regardless of the plan you opt for.
However, you have access to more advanced collaboration features on the team plan. You can assign roles to a team member, assign status (completed, pending, in review, approved, rejected) to each document.
Now, I mentioned you can integrate some of your collaboration tools with Lucidchart. For example, you can install Lucidchart on Asana and collaborate better than you can on Lucidchart. If you have our Asana review, there are many things you can do with Asana in terms of collaboration. You know, assign tasks and sub-tasks, see project dependencies, and get alerted when they have done their task.
Now when you have created a lot of stunning diagrams and you have documents assigned to you. Locating documents you want to work on at that moment might be a hassle. But Lucidchart’s advanced search feature helps you to filter your search by specific properties, including titles, document status, shared, etc.
TRAINING LAB
Lucidchart is not one of those robust programs that don’t leave you weaving through the web of features it offers. Now, beyond knowing how to use the software, Lucidchart helps you understand the concept of diagramming and data visualization.
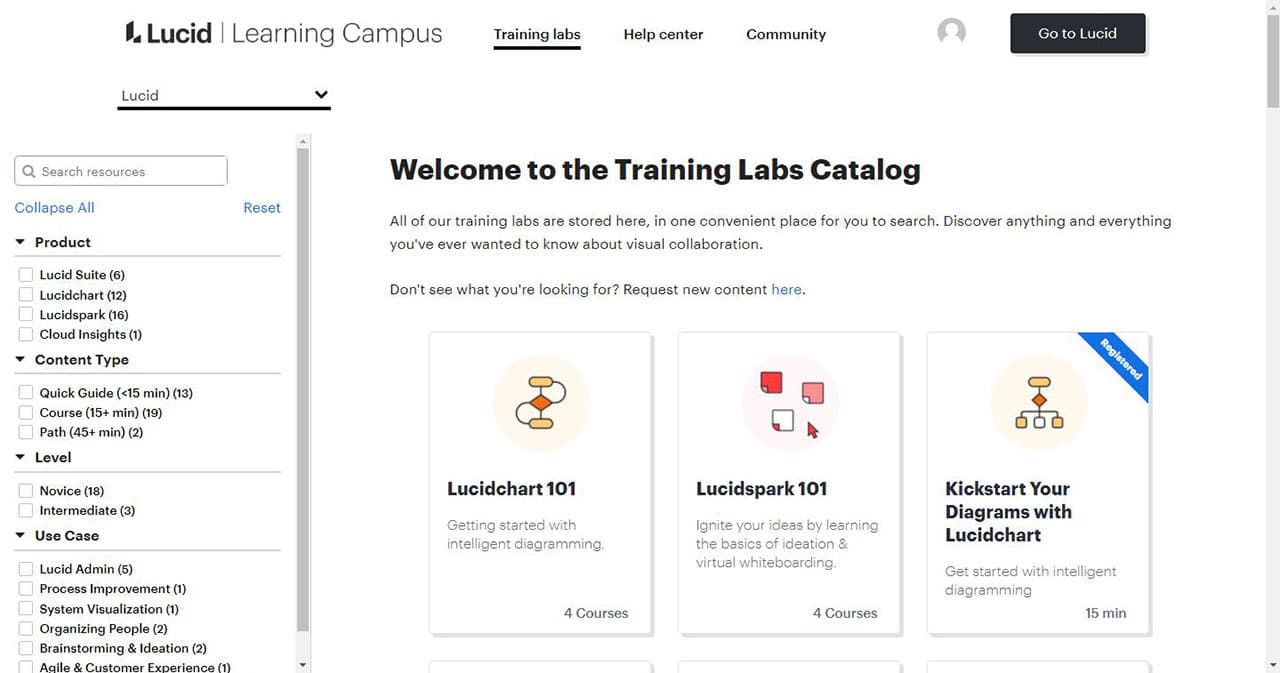
Now, for various professions, diagramming/process design is a skill you must have to secure a certain role. And if you do not know what diagramming is, Lucid chart has an online campus with various courses in intelligent diagramming, ideation, flow-charting, system visualization, and more.
Now, if you are new to intelligent diagramming, or you trying are to introduce your team to diagramming, Lucidchart teaches you the basics of flow-charting and lines. And of course, you will learn how to speed up your diagramming process.
These training features make Lucidchart stand out amongst some competitors. With Visio, you’d need time to figure out how to find your way around the robust functionalities or go as far as taking courses on platforms like Coursera, YouTube.
So this is a great addition for Lucidchart and, of course, folks that want to learn more about using visual diagrams to represent information.
Diagramming
Depending on the profession or role in your team or organization, diagramming might mean different things to people. But the basics are giving a visual representation of certain information, process, or idea to help your team interpret easily. Now using these facts, Lucidchart is a different tool for different professions.
If you are an engineer, Lucidchart makes it easy to draw process flow for your plants and shows the relationship between certain components and processes.
Now, many engineers use applications like AutoCAD, Microsoft Visio, SmartDraw, etc. I mean, but Lucidchart simplifies the process for you. Yeah, it isn’t complex. And if you are such an intermediate in process design, Lucid might be one tool you want to look at.
Now, for business administrators and C-suite level, Lucidchart is a tool you can use to outline your business process and customer maps. Now, of course, as a business, you have a certain goal you are trying to achieve. Of course, a plan is down on paper. Now, Lucid helps you to give stakeholders a visual representation when you are presenting your plans. Make it interactive and quite understanding for everyone.
Now for UX designers, Lucidchart would not be your go-to for wireframing and outlining user processes concerning your product. Buy Lucidchart is a robust tool to draw wireframes. Now, with Lucid, you have tons of templates to draw wireframes and processes, use cases, etc. This would help in your research and development. And, of course, communicate the projection of your product to all stakeholders.
Now, other teams (e.g., marketing, sales, educators, and software developers) can use Lucidchart to create diagrams and explain a certain concept to teams and stakeholders. Educators, for example, can use diagrams to explain certain concepts like UML class diagrams, flowcharts, to a student.
Data Visualization
Now, for data visualization, Lucidchart allows you to simplify complex data. You know, by giving a visual representation to make it easy for your team to interpret and, of course, make actionable decisions. You’d agree that data visualization is a huge part of business intelligence. This means that regardless of your department in your organization, you present certain reports to stakeholders.
For example, you are the sales leader of your organization and you want to give an annual report of your sales efforts. Now let us break it down to sales outreach. Of course, you must have measured key metrics, like your market penetration, conversion rate, lead generation, total, etc.
Now you want to compare the metrics to observe trends in your efforts. You know, to give insight on what you have done differently and how much you spent over the period. With diagrams, you can present this data without drowning stakeholders in the bulk of data.
Now the good thing is Lucidchart allows you to automate this process, so it is faster and saves you the time of creating charts on your traditional spreadsheet. So all you have to do is import a CSV file into the Lucidchart Org chart. And it automates the process for you. Of course, this feature is only available to users on the enterprise plan.
Alternatives To Lucidchart
Lucidchart is an easy favorite. And millions of other people can say the same. And it’s basically because of its ease of use and flexibility. But of course, there are a couple of alternatives to look at. It depends on what type of functionality you want for a visual diagramming software, your budget, your software requirements, etc.
Now the popular alternative to Lucidchart is Microsoft Visio. Yes, it’s a traditional visual diagramming software and many people are moving from Visio to Lucidchart. Yes, Visio offers more tools compared to Lucidchart. But a beginner might find it very difficult to navigate. With Lucidchart, the experience is exhilarating.
Considering prices, you can pay a one time subscription of $280 and $500 for the standard plan and professional plan, respectively. Or you can opt for a monthly subscription that ranges from $5 to $15 per user. Lucidchart has a free plan and paid starts at $6.79.
Now, some other alternatives are Smartdraw, Gliffy, Visme, Draw.io, Creately. The prices also range from $5 to $18.
Conclusion
Lucidchart offers robust functionality and makes it easy to use for users. Now, from beginners to highly skilled professionals, you can do more in little time compared to some other traditional visualization tools.