How to make a Pie Chart in Excel?
If you are wondering to make a pie chart using Excel, there are a few steps that one needs to follow to get the desired results in no time at all.
If you are wondering to make a pie chart using Excel, there are a few steps that one needs to follow to get the desired results in no time at all.

PESTLE, PESTEL or PEST analysis makes use of a wide range of tools that help in assessing the risks and impacts that the environment and external factors play on the overall outcome of the processes involved in an organization.

Whether you’re streamlining business operations, designing decision trees, or mapping workflows, the right flowchart maker can simplify complex ideas into clear, actionable visuals. In this guide, we’ve handpicked the best flowchart makers of 2025—tools that combine intuitive interfaces with powerful customization options. From drag-and-drop simplicity to advanced collaboration and branding features, explore platforms that cater to everyone from project managers and educators to developers and designers. Dive in to find the perfect tool that matches your workflow and visual thinking needs.
Venn diagram is a pictorial representation of logical or mathematical sets in form of circles. The intersection of circles shows the common elements of two or more sets.

Looking to streamline your team’s structure visually? Whether you’re managing a small business or scaling a global enterprise, organizational charts are essential for mapping hierarchy, improving communication, and aligning teams. In this guide to the Best Org Chart Makers of 2025, we explore top-rated tools that help you design professional, easy-to-understand org charts. From intuitive drag-and-drop interfaces to advanced customization and sharing options, these platforms are ideal for HR professionals, managers, and business owners seeking clarity and collaboration across teams.

Program Evaluation and Review Technique, otherwise known as the PERT chart is responsible for helping understand the tasks in schedule and understanding the involved variation in the Critical Path Method.

The world is full of trillions of compounds, elements, molecules, and atoms. These words would take anybody in the world of chemistry – a science subject which studies everything pertaining to the making of any substance. This is crucial to understand the behaviors and stop violent reactions that might occur. Interpreting any material, its constituents, … Read more
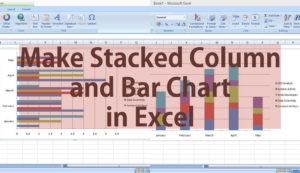
If you have always wanted to get a better visual representation of your data in a column or bar chart format on Excel, we have it sorted out for you here.

A line graph or chart shows series of data as points/dots which are then connected with lines to display the trends. It is one of the most popular method to compare and examine the values.

A rack is a frame used to organize and hold various hardware devices. And a rack diagram is a graphical presentation of such rack system.