In an era where quick visual communication is key, pie charts remain one of the most intuitive ways to present proportions and percentages. Whether you’re illustrating budget allocations, customer demographics, or survey results, a well-designed pie chart delivers clarity at a glance.

But not all chart-making tools are created equal. In 2025, the best pie chart makers offer far more than colorful slices—they provide customization, interactive features, data imports, and seamless sharing across devices and platforms. From marketers showcasing campaign impact to educators teaching statistics, these tools simplify data storytelling without the steep learning curve.
This guide breaks down the top pie chart generators of 2025—evaluating them on design flexibility, usability, data handling, and export options. If you want to go beyond basic spreadsheet charts and give your data the visual appeal it deserves, these are the tools worth exploring.
1. Visme – A Powerful and Intuitive Pie Chart Maker

Visme stands out as one of the best pie chart makers of 2025, offering a seamless and creative experience for turning data into engaging visuals. Whether you’re a professional or a beginner, Visme’s intuitive platform makes pie chart creation both simple and visually appealing.
With dozens of premade templates, Visme allows users to start with a design that suits their dataset or aesthetic. Just input your data manually or sync live from Excel or Google Sheets, and Visme’s Graph Engine dynamically adjusts your chart. The interface supports full, 3D, donut-style pie charts, along with detailed customization of colors, fonts, legends, and labels.
You can also color-code slices, display values as percentages or decimals, and animate your charts for added impact. Pie charts can be downloaded as image files or embedded directly into websites, presentations, or reports.
Key Specs:
- Data Import: Manual entry, Excel & Google Sheets sync
- Chart Types: Flat, 3D, full, donut pie charts
- Customization: Colors, fonts, labels, animations
- Templates: Dozens of pre-designed templates
- Output Options: Download or embed interactive charts
- Branding: Use custom fonts, colors, and logos
Pros:
- User-friendly drag-and-drop interface
- Live data syncing for real-time updates
- Great selection of templates and design assets
- Ideal for non-designers and professionals alike
- Animation support for interactive visual storytelling
Cons:
- Some advanced features require a premium plan
- Heavier visual projects may require good internet speed
- Limited offline functionality
Visme is an excellent tool for professionals looking to create clean, interactive pie charts without a steep learning curve. Its robust design options and live data features make it one of the top pie chart makers for 2025.
2. Edraw Max
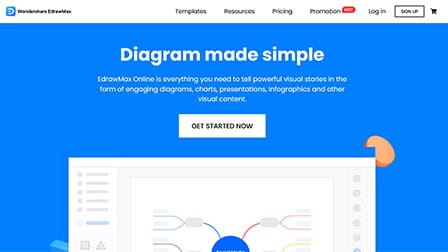
Edraw Max is an affordable, multi-purpose diagramming software compatible with Windows and Mac operating system that supports creating icon and info graphically interactive and appealing pie charts from a gallery of stock images or templates.
Variations in pie charts like percentage pie, simple pie graph to multiple pies, 3D pie and Pie of pie, that fits into several corporate business requirements can be provisioned through this software.
Every professionally appealing pie chart derived instantly from this software can be enriched with in-built advanced features such as symbols and tools that function to manipulate the graphs to make them appear visually attractive and stir a good understanding of ideas to the audience.
Data on the graphs can either be imported from relevant documents or data labels can be edited through buttons and pointers. Edraw Max is home to Pie star templates, which are vector files that can be addressed as templates.
Pros:
- Has a comprehensive suite of diagramming tools
- Professional looking charts
- Has online and desktop versions
Cons:
- Overwhelming UI
- Limited collaboration features
3. Vizzlo
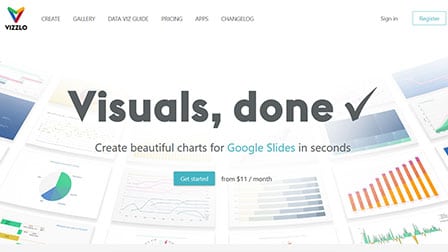
To configure pie charts to embed in Powerpoint presentations or Google Slides, Vizzlo can be noted as a suitable destination for capturing and presenting graphical data.
With top-tier brands placing their trust on Vizzlo, pie charts accessed with this tool can be safely branded as per the organizational policies, enhanced with fonts, colors, company-specific logos and various other factors on the navigation friendly interface.
Breaking down complex data for a better understanding of the subject is the most basic advantage one can avail from this application.
Vizzlo also makes room for team collaboration on the pie charts so that all the team members are on the same lines for sharing of ideas, accessing, reviewing and amending the charts which are stored on the cloud, with an added feature of document history to track changes.
Additionally, it provides a scope for analysis through its analysis functions before documenting the pie chart.
Pros:
- Supports different types of chart templates
- Real-time collaboration
- Easy integration with other platforms
Cons:
- Free version has limited features
- Advanced charts require paid subscription
4. Fotor

The intuitive online pie chart maker is one of the many advanced features of Fotor that enables users to create visually appealing and informative pie charts effortlessly.
If you are looking to present the data in a more visually pleasing format, this is the tool you need to indulge in.
With Fotor’s Pie Chart Maker, users can input their data directly or import it from spreadsheets, making the process seamless and time-efficient.
The tool offers a variety of customization options, allowing users to personalize the appearance of their pie charts, including choosing different color schemes, adjusting slice sizes, and adding labels and legends to enhance readability.
Pair that with the user-friendly interface that’s ideal for beginners and advanced users to navigate through the chart-making process in no time. Ideal for educational purposes, business presentations, or data analysis, Fotor is a versatile pie chart maker that enables you to transform your raw data into insightful visual representations.
Pros:
- Simple and intuitive interface
- Easy to use customization features
- Integration with Fotor’s other design elements
Cons:
- Limited chart types
- Not suitable for complex chart creation
5. Piktochart

If you are on the hunt for a powerful and user-friendly tool that enables the users to create informative pie charts, Piktochart is the one.
Designed for educators, marketers and professionals, this feature-rich tool enables you to transform your data into a graphical format with a few simple clicks.
The pie chart maker consists of an intuitive drag and drop interface, which ensures that even people with limited design experience can master it in no time. Integrated with a diverse range of customizable templates, creating pie charts has never been easier.
Beyond its aesthetic appeal, the Pie Chart Maker also offers practical functionalities. Users can input data manually or import it from spreadsheets, and the tool automatically calculates percentages, easing the chart creation process further.
Overall, the tool is comprehensive, intuitive and very interactive, making it easier for you to create your much-needed pie chart in no time at all.
Pros:
- Makes visually appealing pie charts
- Easy drag and drop interface
- Has a library of templates
Cons:
- Limited access to templates with free version
- Export options are restricted for free users
6. Xara

Another popular and interactive web-based application for all your pie chart solutions is Xara.
This user-friendly tool allows you to create your favorite visually compelling pie charts in no time at all.
The versatile tool is designed to cater to a wide range of users, from beginners to experienced professionals.
Besides the reliability, Xara offers a smooth and enjoyable chart creation experience, where the users can input their data and create a pie chart from scratch in under two minutes. Besides templates, the tool also offers various customization options with color schemes, fonts and labels.
One of the unique features of Xara is that it offers real-time previews before you save the final chart. This ensures that you can glance through the final draft, check if any changes are required and make them before you save it to your device.
Sharing and exporting the final creations is a breeze, enabling users to integrate their pie charts seamlessly into reports, presentations, websites, or social media posts.
Pros:
- Powerful chart making capabilities
- Optimal customization features
- Ideal for professional designers
Cons:
- Interface is a little laggy
- Paid version is quite expensive
7. Canva
A tool accessed online to help one create colorfully artistic pie charts which are easy in use and completely free, Canva is the basic tool to produce pie charts in seconds.
Picking from a template of choice, one can update the data with clicks or drag and drops, personalizing the chart with colors, fonts, background or layouts and choose to design over 20 types of simple to professional graphical charts effortlessly.
Conveniently used by brands like Sky scanner, Los Angeles among others, Canva makes team-work on a single chart feasible, deciding on Edit and View access, by storing the chart on the cloud to help one explicitly make changes or edits to the graph repeatedly without a fuss.
The pie charts generated can be easily downloaded and published or shared as high-quality files and embedded into presentations, shared on the mail or social media and can be saved as high-resolution images.
Pros:
- Highly user friendly
- Free version is more than enough
- Optimal range of templates
Cons:
- Doesn’t have good collaboration features
- Advanced elements require paid subscription
8. Appy Pie

Another interactive and holistic online pie chart maker worth mentioning in the list is Appy Pie.
This is a comprehensive and powerful tool that enables you to create a pie chart with a few simple clicks and no formal technical knowledge.
Featuring an user-friendly drag and drop editor, individuals can use the raw data and transform it into an interactive graphic design in no time at all. Creating customized pie charts with Appy Pie makes it easier for the users to convey the data and statistics more accurately.
Irrespective of the purpose, be it for business reports, academic presentations, or data visualization purposes, this tool simplifies the process of crafting professional-looking pie charts in just a few clicks.
Also, the created pie charts using Appy Pie are very dynamic and responsive, making exporting and sharing a lot easier. It is not a complex software, so you don’t need technical expertise to use it.
Pros:
- Cloud-based platform
- Ideal for beginners
- Easy to use UI
Cons:
- Charting features are limited
- Advanced customizations aren’t available
9. SmartDraw
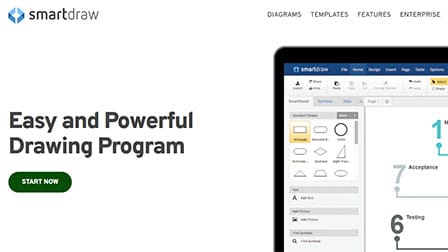
Helping you make pie charts effortlessly at affordable costs, SmartDraw has nestled its way into the best pie chart making applications in 2025.
This software makes adding pie charts to any diagrams easy by simply importing the data and choosing the graph time alongside displaying the same data in different graph formats.
With the help of intuitive controls coming in this application, one can edit the charts to change the colors, and provide legend placement whilst easily swapping between chart types.
However, one of the outstanding features of SmartDraw is that it is packed with professionally-designed templates to cater to the most common marketing matrices, diagrams, and infographics. It offers effective team collaboration and customer support.
One can also craft pie charts for Word, Excel PowerPoint, or any other Google Workspace app through this software. The charts once done can be then easily shared among various team members via links.
Pros:
- Professional grade pie chart making software
- Extensive library of templates
- Easy integration
Cons:
- Requires subscription for advanced features
- Not ideal for beginners
10. DesignCap

For the users looking for ways to create informative pie charts, DesignCap is the option you need to look into.
This one is unlike any of the other graphics software, thanks to the comprehensive layout and user-friendly user experience.
The platform hosts a vast variety of customizable templates with an intuitive drag and drop feature that enables you to create accurate pie charts in a few minutes without any prior design experience.
The tool allows users to input their data and instantly transform it into a beautifully organized pie chart, making complex information easily understandable at a glance. Users can modify the chart’s colors, labels, and styles to match their brand or presentation theme.
Being able to save the final draft of the pie chart in different formats like PNG, JPEG, PDF is hands down one of the most notable highlights of this tool.
Pros:
- Easy to use interface
- Wide range of templates
- Direct export and sharing options
Cons:
- Free version has limited template access
- Advanced design options require paid subscription
Related:
- Top 10 Best Online Gantt Chart Maker
- Top 10 Best Flowchart Maker
- Top 10 Best Organizational Chart Software (Tools)
Verdict
Based on the thoughts noted and strategically analyzed for the best-used pie chart maker in 2025, one can be assured that all the mentioned applications run on more or less similar guidelines of abstracting statistical data into a variety of pie charts following three to five straightforward steps which consume very less time and are super easy to execute.
- Also check: How to make a Pie Chart in Excel?
Canva, Visme, and Vizzlo can be considered primary-level tools for pie charts, with Canva and Vizzlo, incorporated in use by top companies. These tools appear to be a fundamental choice as they are cost-free and can be browsed on any device or browser.
RapidTables are calculation and conversion based tools when compared to the others which are more graphical diagram centric.
Edraw Max is the only application in the form of software that is highly recommended and can be approached by a lot of professionally skilled users for their technically advanced features and different categories of pie charts. Infogram is also a well-rated and most sought after tool among the others.
But Venngage can be considered a winner of a pie chart maker for its coherent approach and interactive interface in prepping and delivering high-quality pie charts effortlessly.

