Content creators, bloggers, and anyone who owns an online business need infographics, presentations, and other visual assets to create engaging content. That’s why we’ve tried many different tools to find a solution that caters to this need and found Visme the best among all.
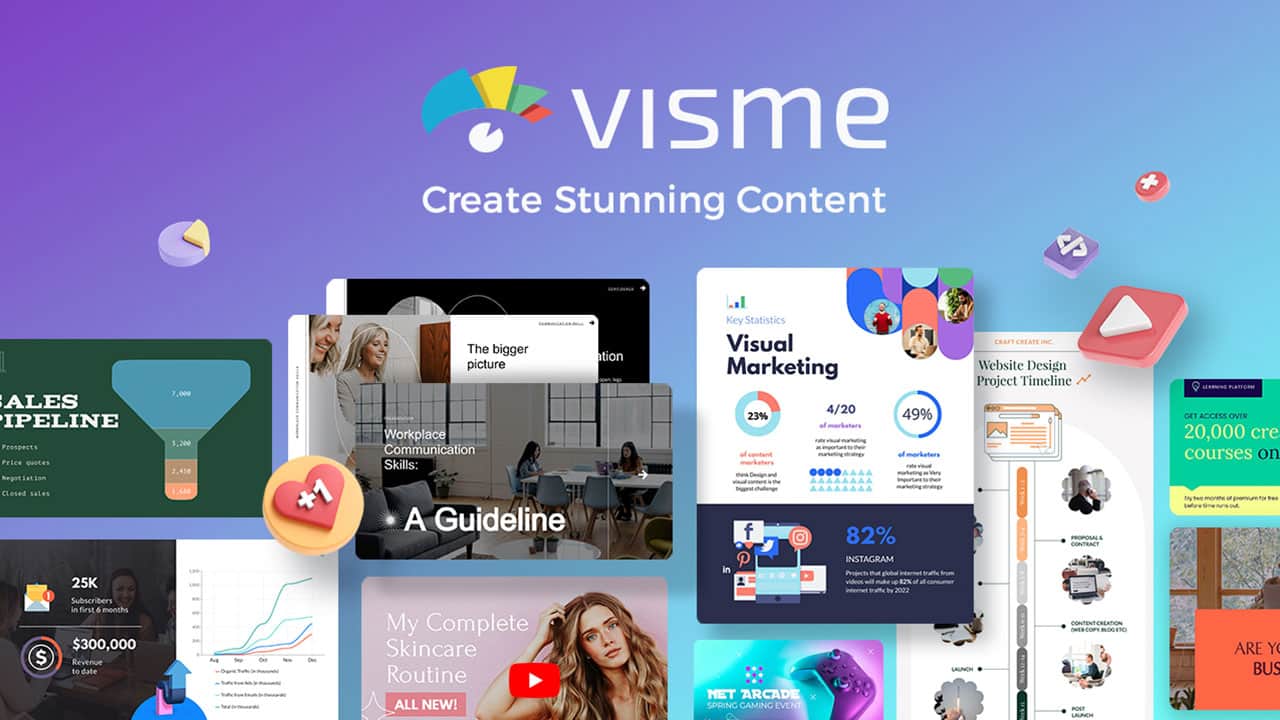
Visme, a powerful design platform, is buzzing in the design community.
And the best part is that you don’t need to be a professional designer to create stunning graphics, presentations, animations, and social media content.
Furthermore, you can use it to create branded charts and graphs for data-driven articles. And when you use these beautiful and informative visuals in your content, more people tend to share it, which increases your chances to get backlinks.
Sounds interesting?
Stick with this article till the end because we will tell you everything about this amazing graphics design tool, including its features and pricing.
Contents
What is Visme?
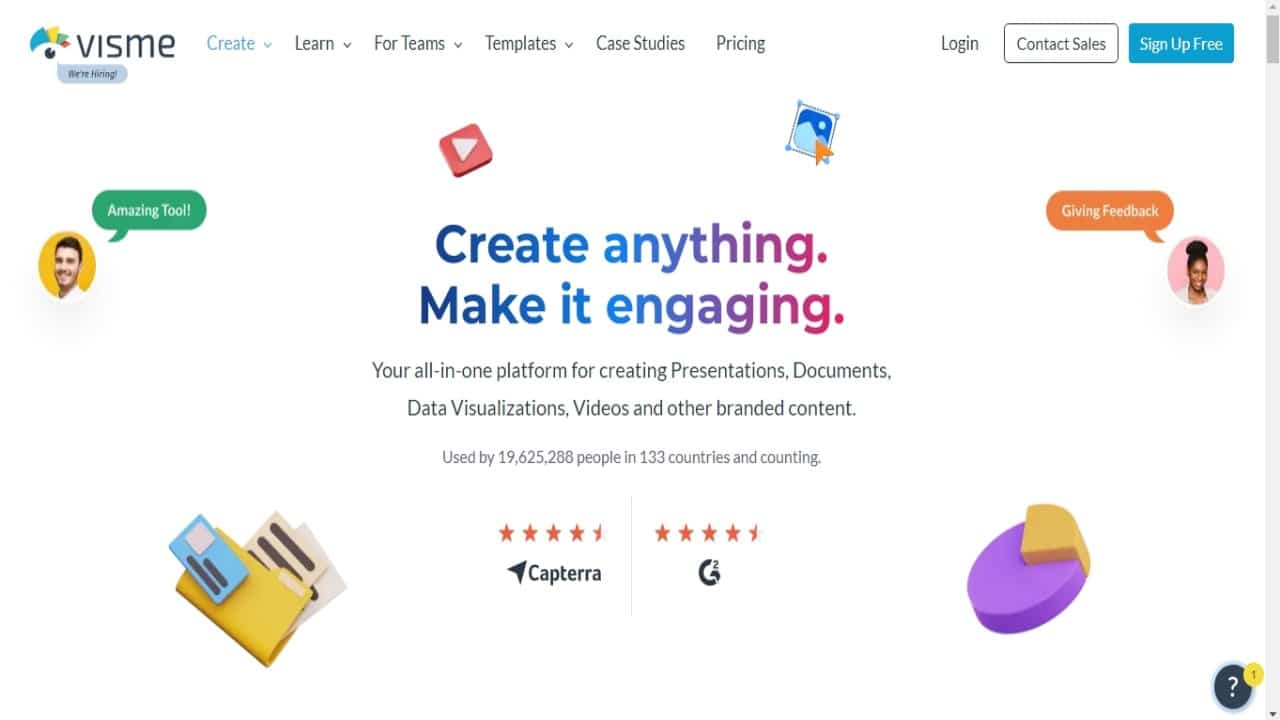
Visme is an online designing platform that offers unique features to people looking for an alternative to professional graphic design software like Adobe Photoshop.
And what makes it appealing to content creators and online businesses is its easy-to-use drag-and-drop interface, which allows even non-designers to create professional-level visual content.
Besides images, you can also create animated presentations, charts, and graphs. If you’re building an email list, this will help you publish eye-catching lead magnets. Also, it will benefit your link-building campaign, as custom graphs and charts will make more people link to your content.
Visme interface and features
Visme provides an easy-to-use and simple interface. Upon logging in, you’ll be redirected to the dashboard. In the dashboard, you can start your design project by clicking the “Create New Project” button.
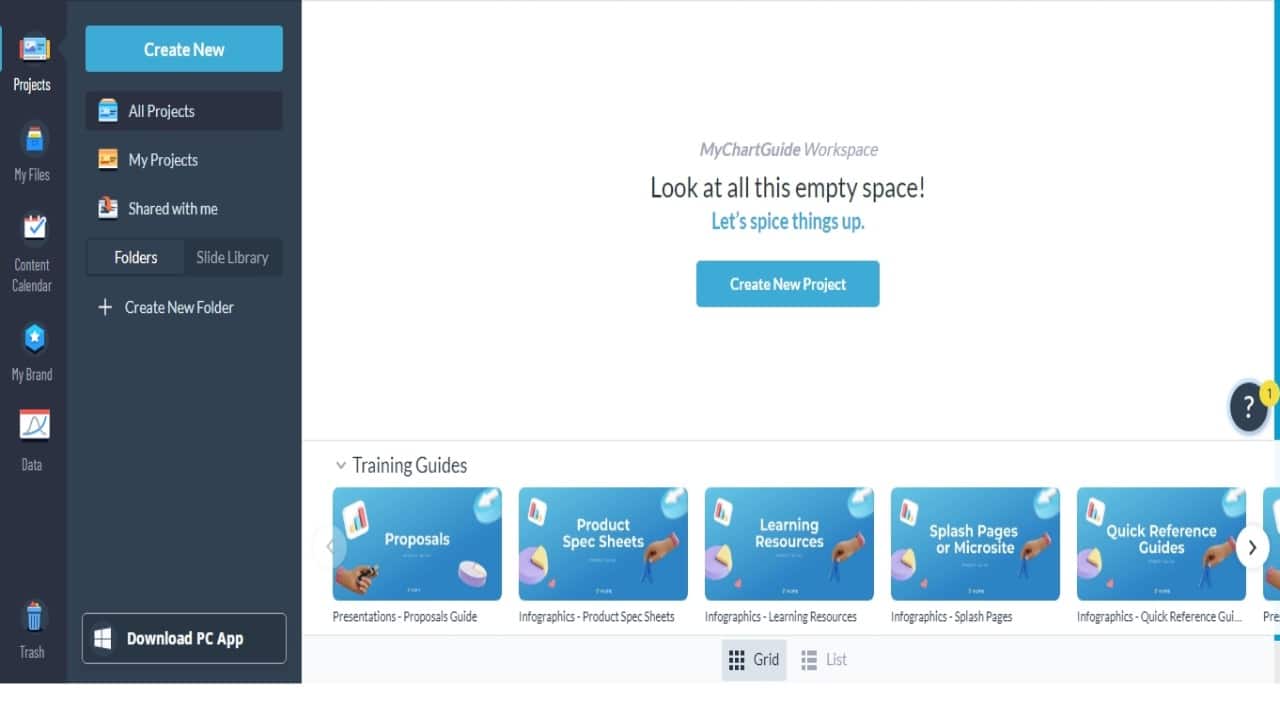
You can also use the “Create New” button from the sidebar to start a new project.
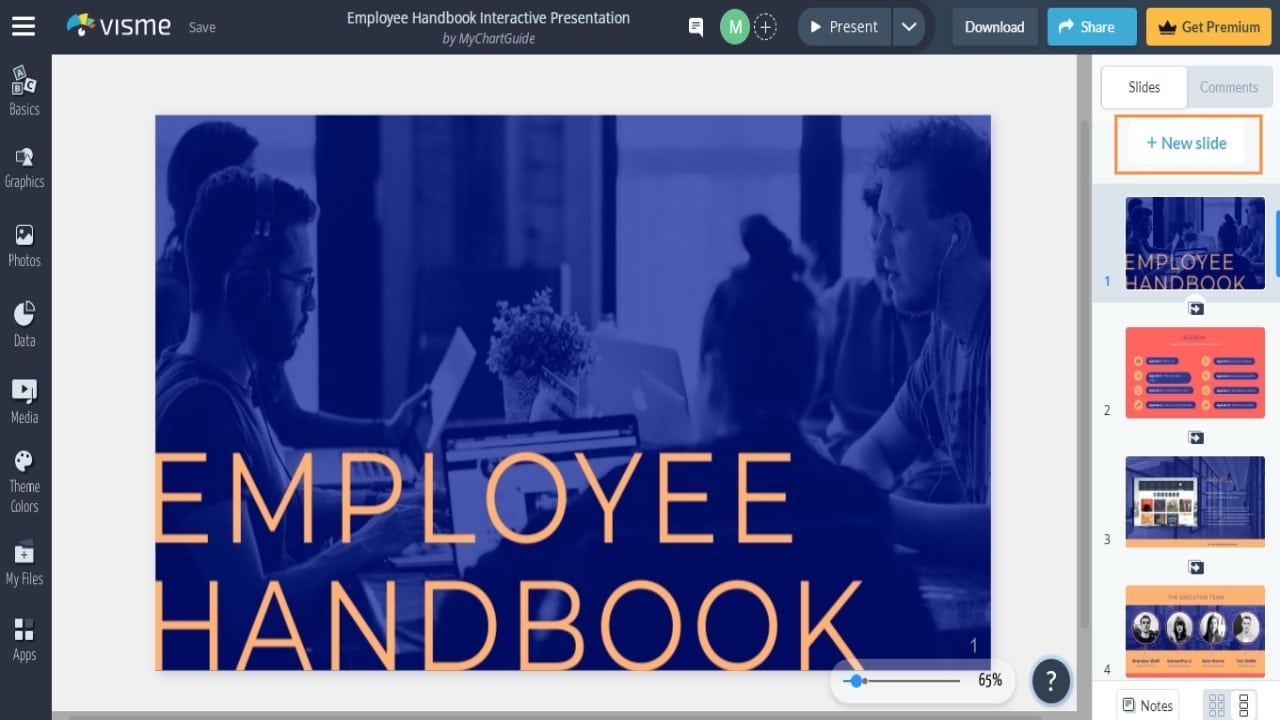
Templates
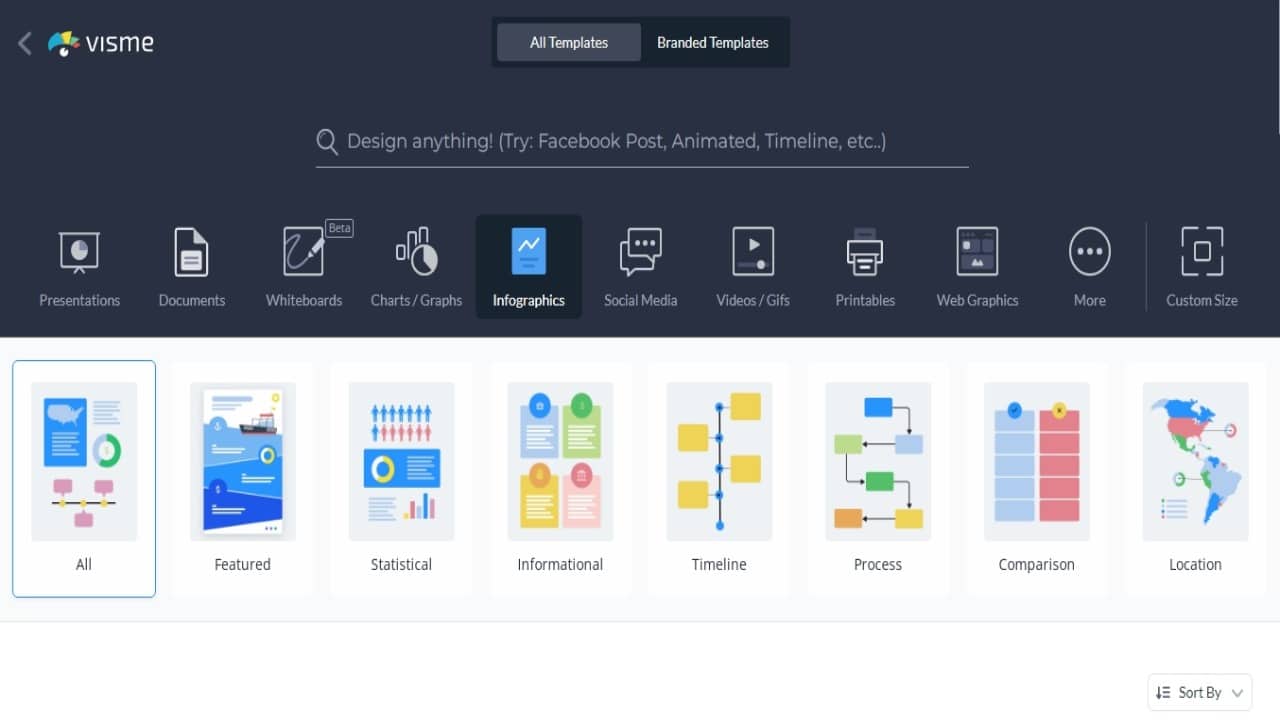
Once you click the “Create New Project” button, you’ll see a default list of designs popular among content creators, such as case study templates, infographics, presentations, website templates, etc. However, if you are looking for something else, use the search bar.
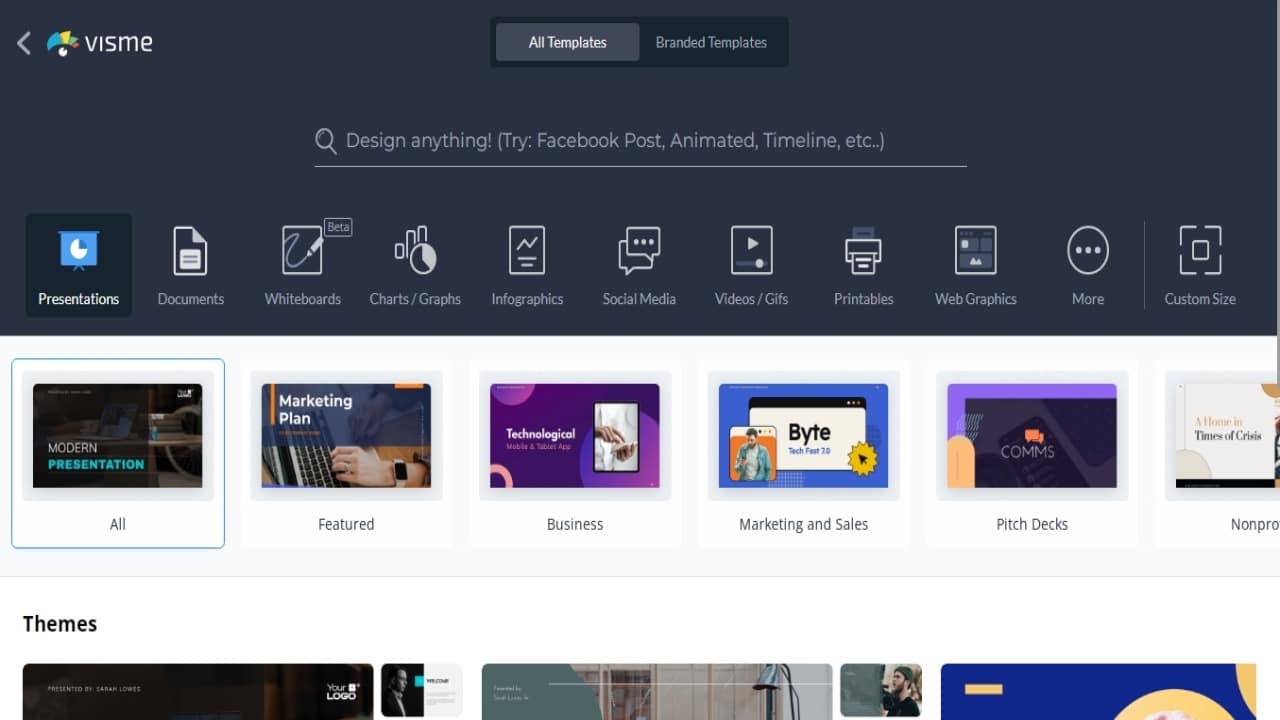
When you click on any of the given designs, it shows you related templates that you can use to start your project.
For instance, if we click on infographics, it will reveal all the available infographic templates. The templates you see here are categorized by purpose or industry. And any template you choose is designed professionally and is fully customizable.
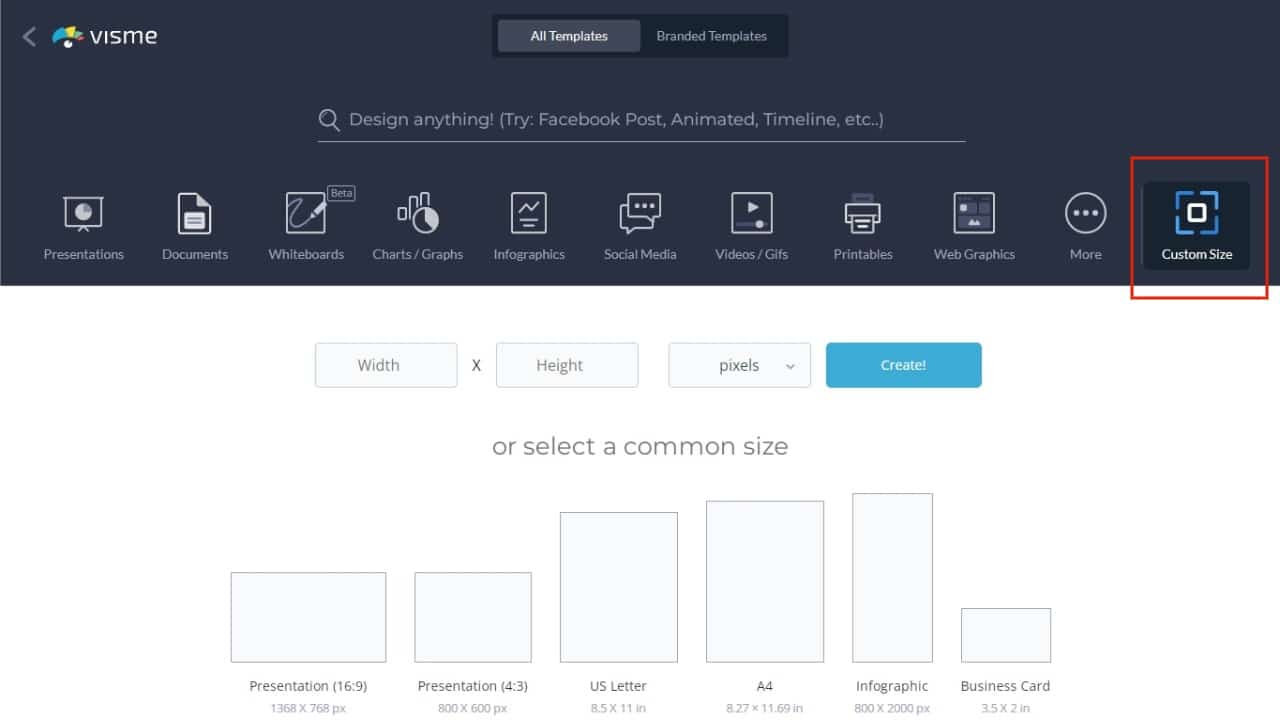
Else, you can start a new project from scratch. By clicking on the “Custom Size” option, a blank canvas will be created where you can adjust the width and height in inches, pixels, and centimeters. Or you can choose a common size from the list.
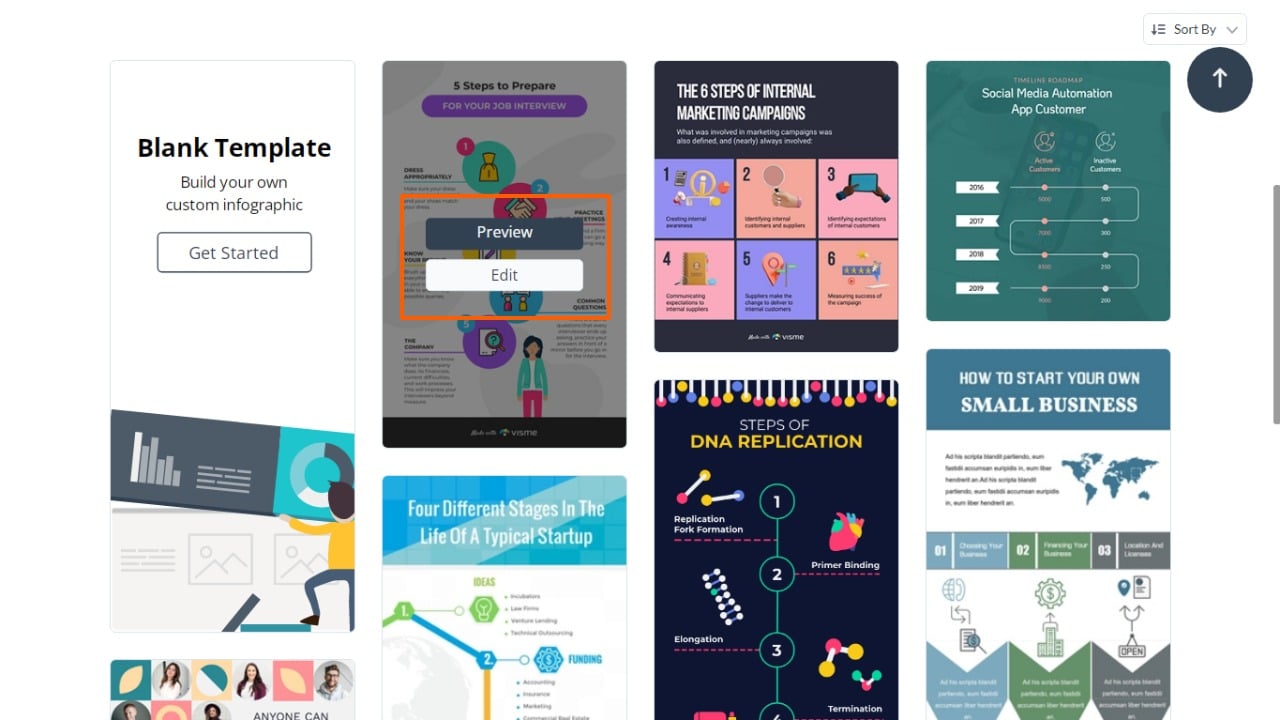
But for this article, let’s stick with Visme’s pre-designed templates.
Hovering over the template of your choice will show two options — “Preview” and “Edit.” Clicking on “Preview” will show the template preview, and clicking the “Edit” button will take you to the design area.
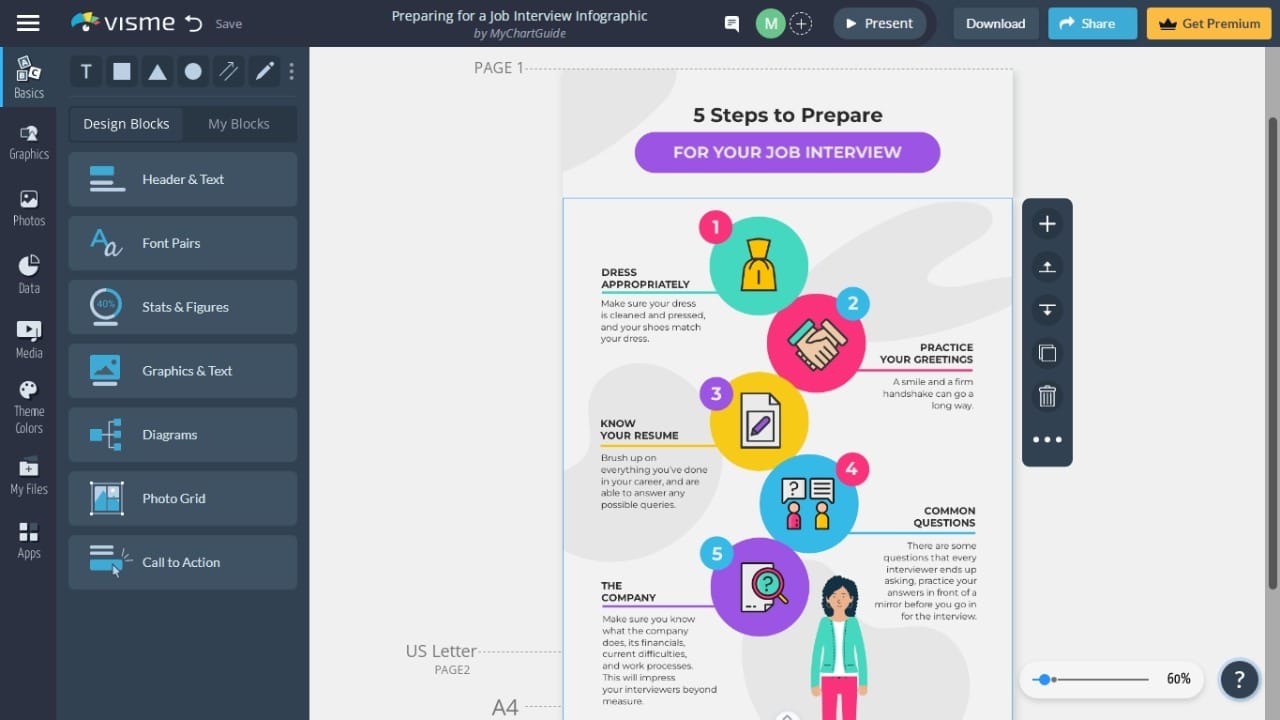
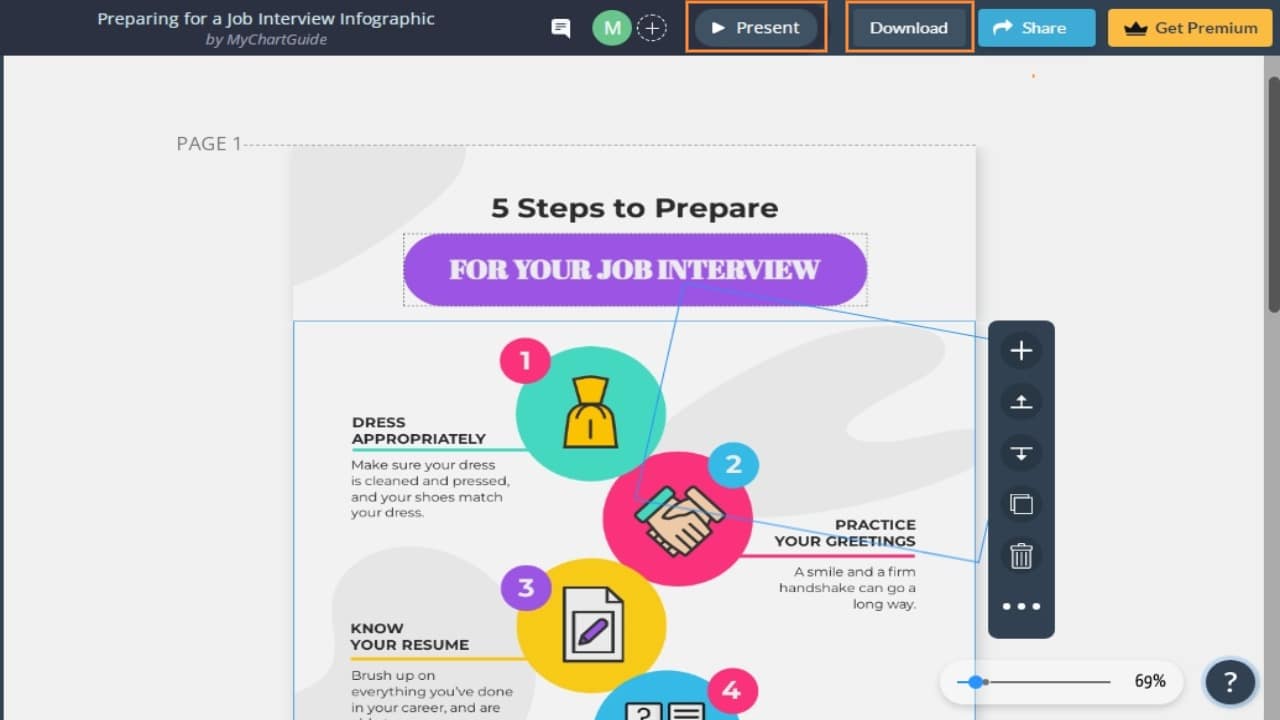
Design Area
Here comes the main feature of the tool — Visme’s powerful graphic designing area.
In this area, you will customize the templates by editing texts, adding elements and diagrams, changing colors, etc., to make them the way you want.
Since so many design options are available, we can’t cover all of them here and recommend you explore them on your own. But we’ll give you an overview of the main features of this tool.
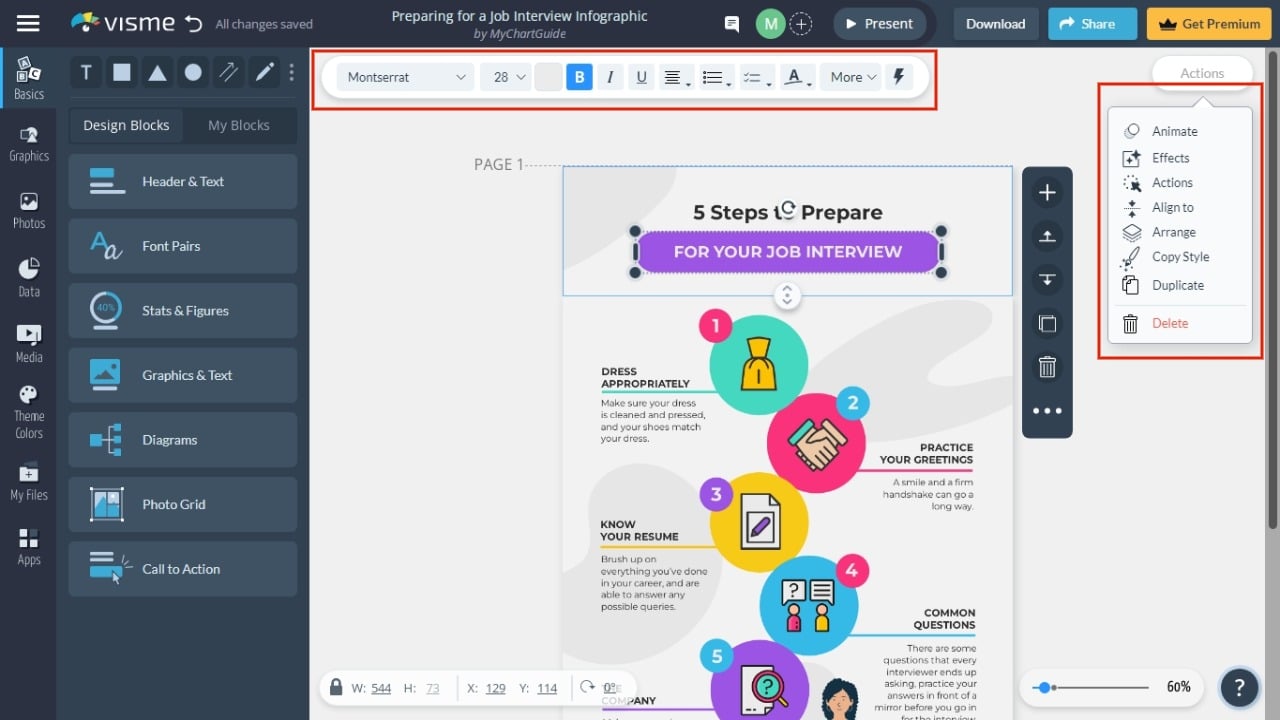
Hovering over the template will highlight the editable elements. To edit any of them, click on it, and the various options will appear.
For example, when we hover and click on the text, it allows us to customize it in various ways. From changing fonts to making them animated, you can do everything you can think of.
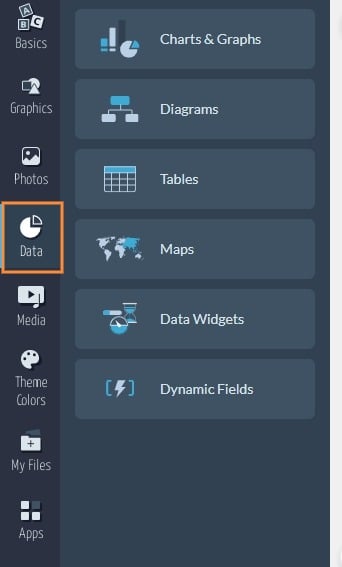
When creating a presentation or infographic where you need to put data from Google Sheets or Microsoft Excel, you don’t need to do it manually, as you import the data directly.
Click the “Data” option from the left sidebar and choose the element you want to add to the template, such as Charts & Graphs, Diagrams, Tables, Maps, etc.
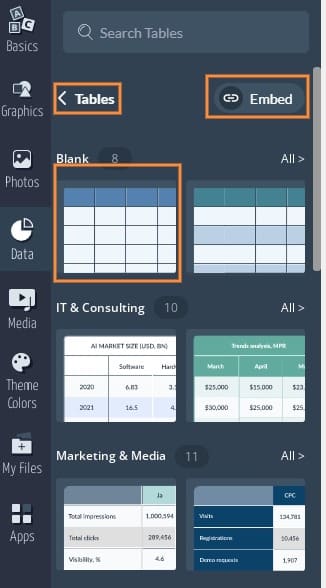
Let’s add a table.
After clicking on the table, you can create a table from scratch or use the pre-built table template. You even have the option to embed the table from Google Sheets or Airtable.
Once you add the desired element to the template, click on it once and then click the “Edit” button.
You’ll see the “Connect Data” option in the design area’s upper left corner, allowing you to fetch data from your Google Sheets or Microsoft Excel file.
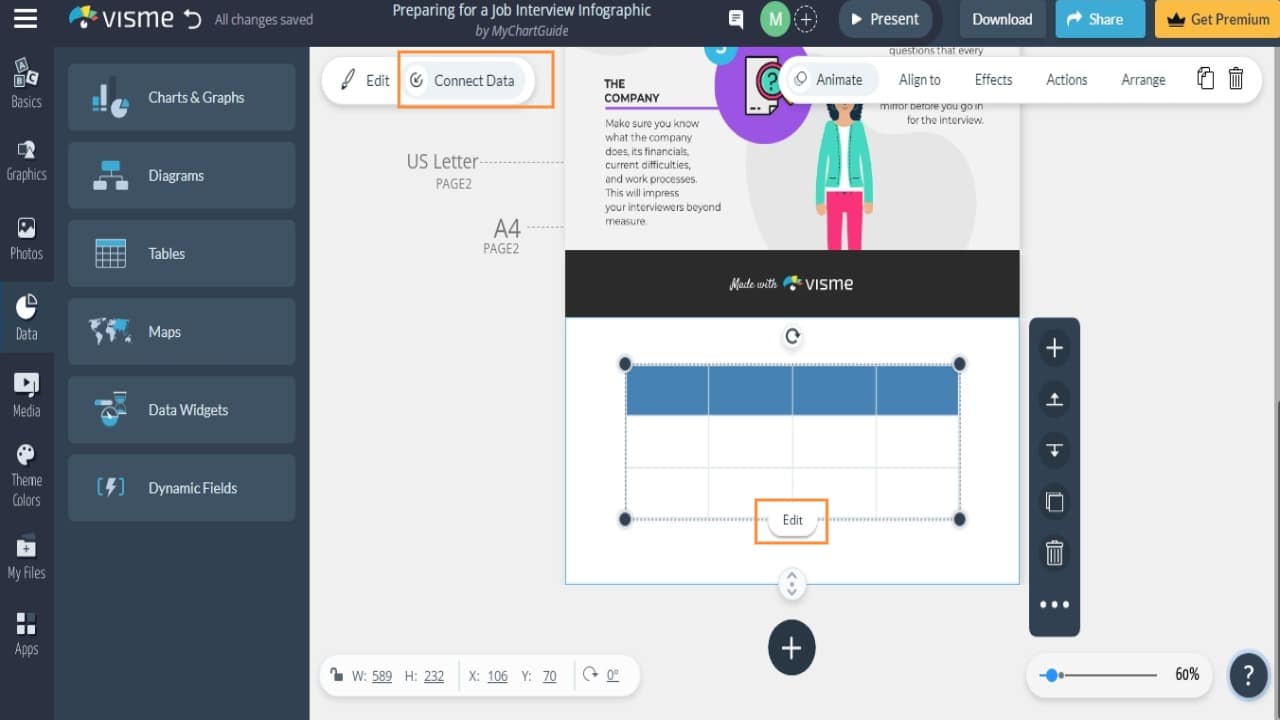
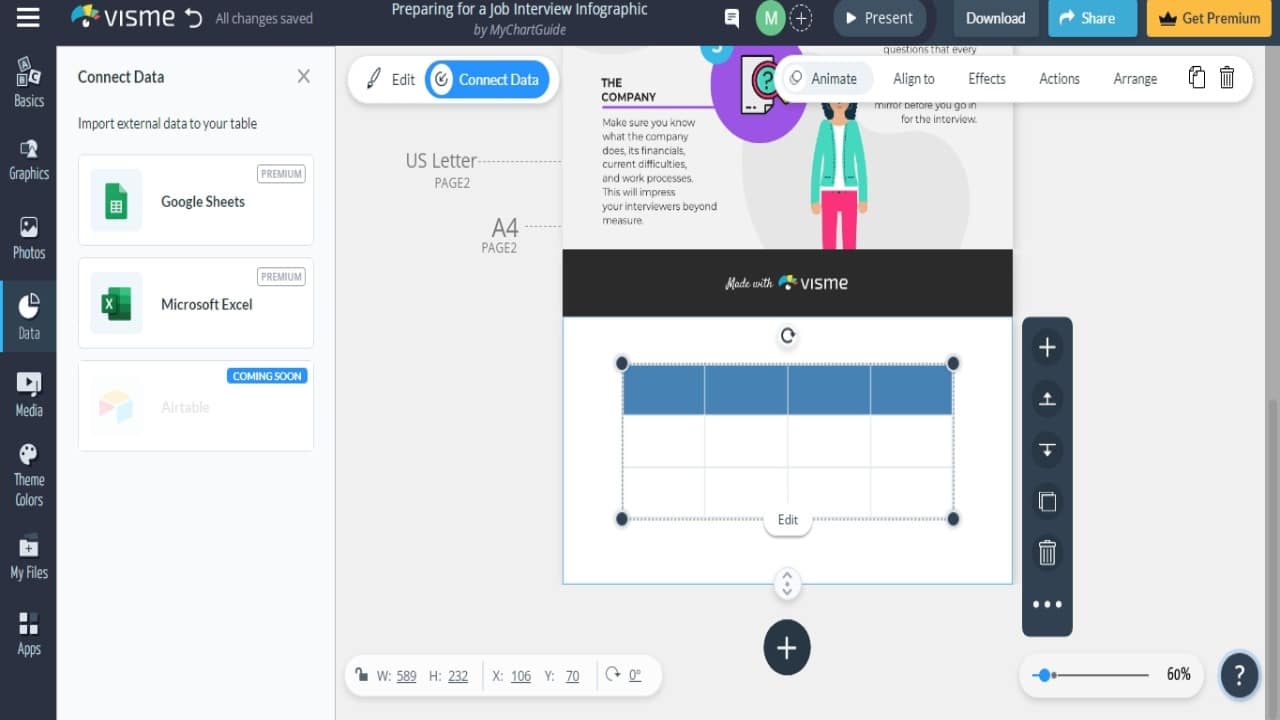
You also have settings to change the element’s colors, borders, and theme.
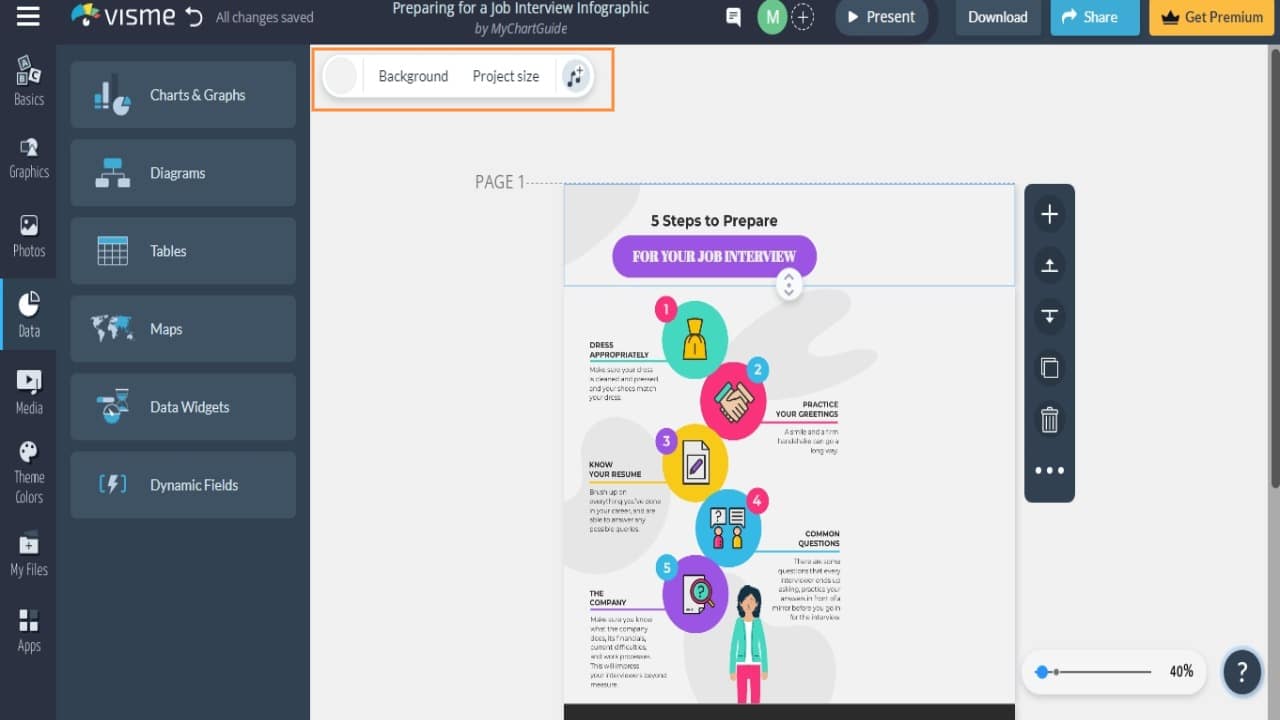
To remove any element, simply click on it and hit the delete key. Clicking on the background will allow you to alter the size or color of the canvas; not only that, you can even add background music.
Animation
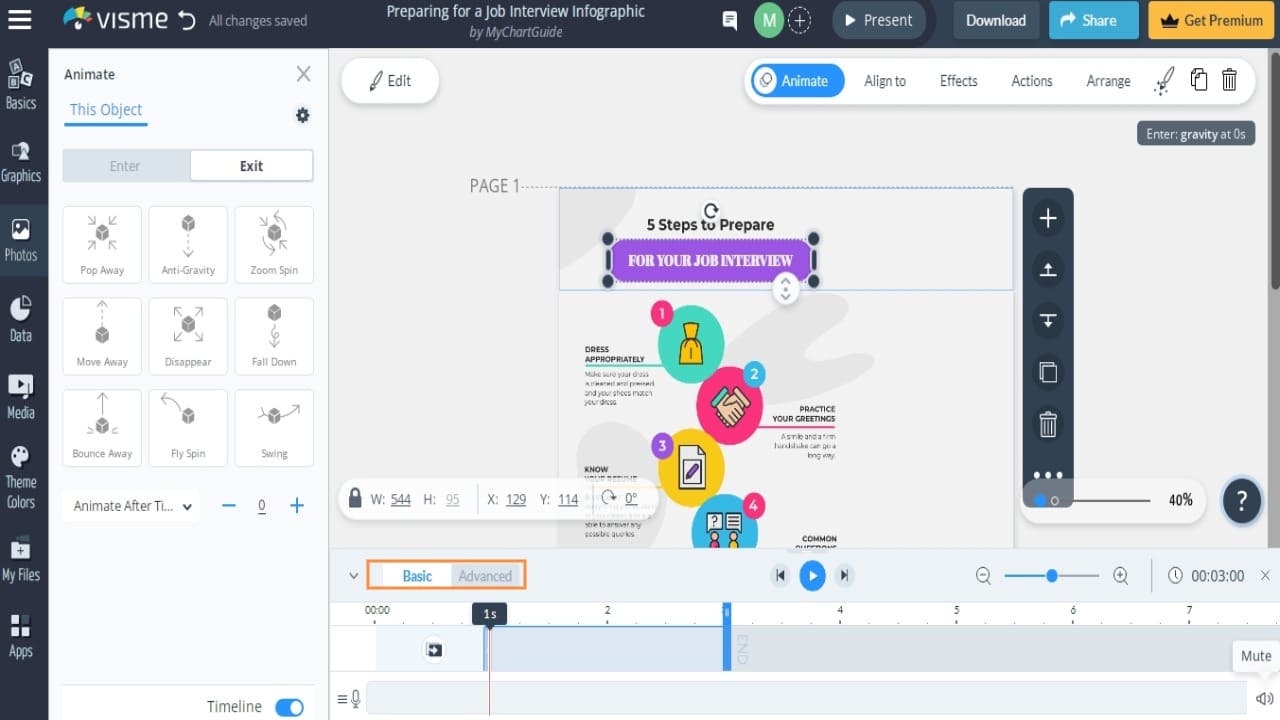
As we already told above, you can animate elements in the template.
To know – what elements can be animated, click on the element; if it shows the “Animate” option, you’re good to go.
If the animation panel looks foreign to you, don’t worry. It’s not that difficult. With some practice, you’ll get used to it.
And once you master it, it won’t take much time to create and publish beautifully animated infographics and other interesting visuals.
Whether you animate a single element or the whole page, you can use a variety of actions, from simple ones like fade in and fade out to complex ones like fly spin or anti-gravity.
After selecting the animation type, you’ll see a timeline below the page that lets you adjust the animation speed. You can also switch between Basic and Advanced modes that expand or collapse the timeline.
Sidebar Customization
The sidebar of the design area has all the customization options to make your complex idea a reality.
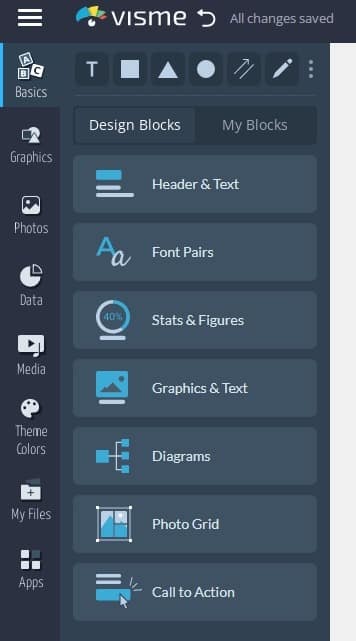
Basics
The basics section provides all the necessary elements to update your design, such as headers & texts, font pairs, stats & figures, graphics, diagrams, photo grids, calls to action, etc. And if you want to access the previously saved content, you’ll find that in the My Blocks option.
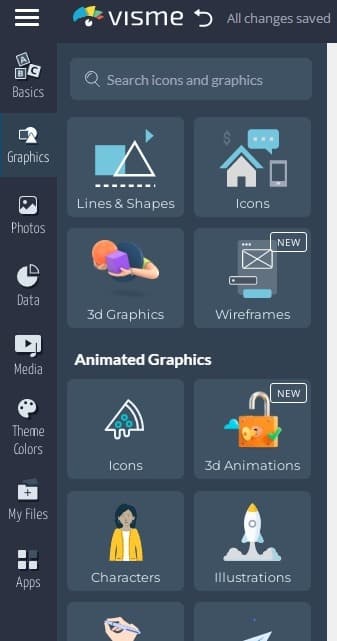
Graphics
In this section, you’ll find lines & shapes, icons, 3D graphics, illustrations, characteristics, etc. It also contains animated graphics with special effects, gestures, and avatars.
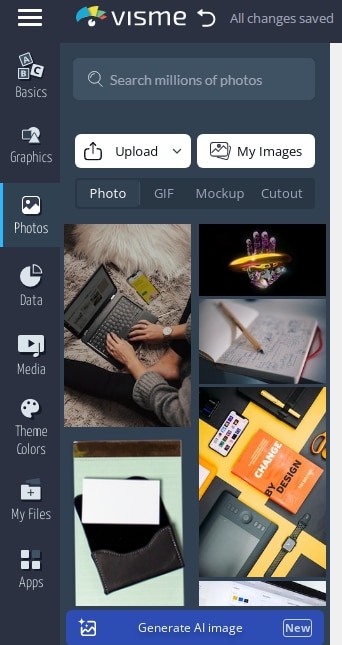
Photos
This section will provide you with high-quality and free-to-use stock images, GIFs, mockups, and cutouts which you can insert into your template.
Also, you can upload your own image files here. Recently, Visme has introduced an Ai image generator, where you describe what you want to create, and the Ai will generate the desired image.
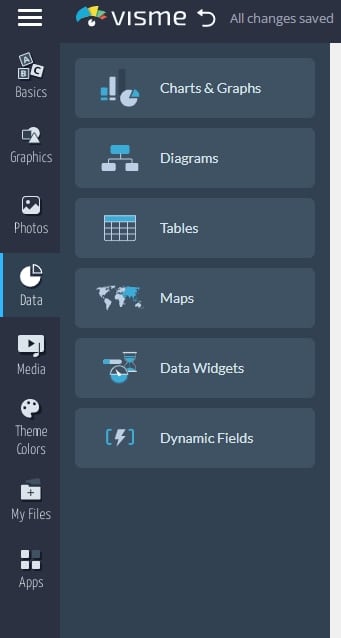
Data
You need to use this section if your design includes figures and numbers. Here you’ll find many ways to present your data, like charts, tables, maps, diagrams, and widgets.
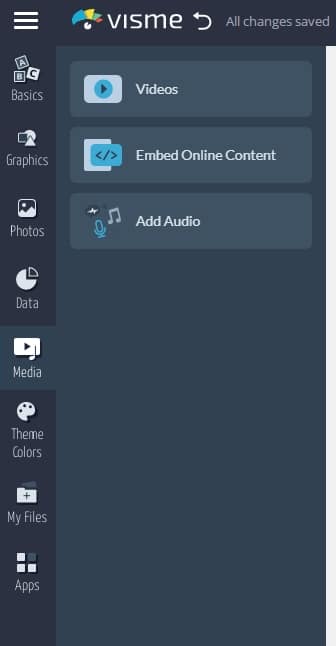
Media
The media section lets you insert or embed videos and audio files into your presentations.
There’s a large stock video library available from where you can choose from thousands of high-resolution videos, or you can upload your own videos too.
The same is true for audio files. You can use stock audio files based on the genre or mood; you can also upload your own audio or even record your audio right there.
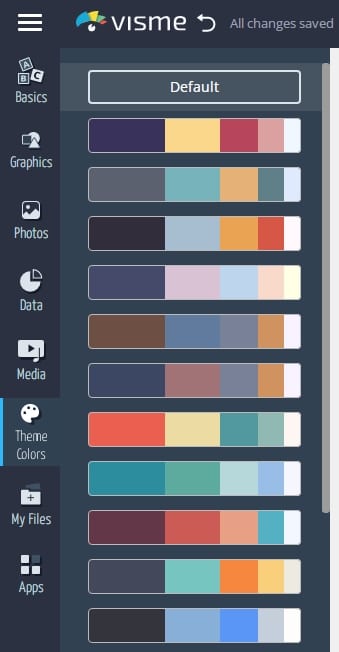
Themes
The theme offers a combination of colors that you can use in your design. This feature is especially useful for creating branded content where you need the same theme color for all the content.
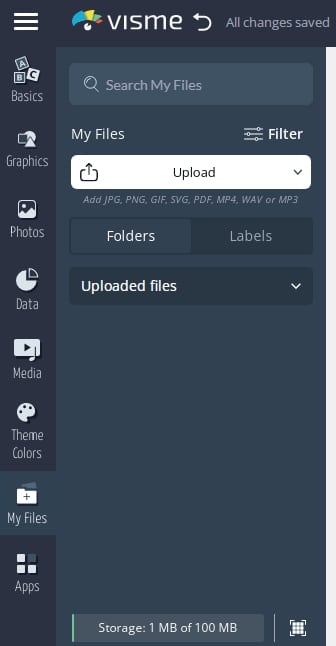
My Files
This is where you can upload your files and see previously uploaded and used files. At the bottom of this section, you’ll see the usage of your available storage.
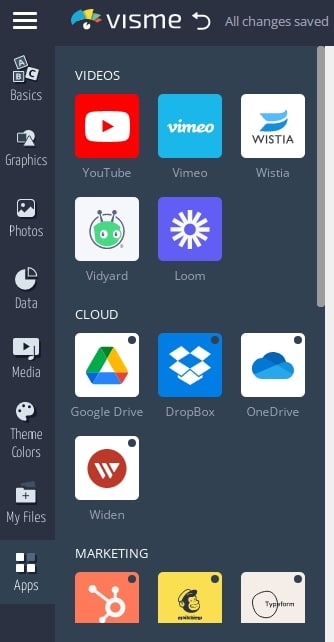
Apps
The apps section will allow you to embed or insert files from third-party services. For example, you can embed a video from Vimeo by clicking “Vimeo” and pasting the URL.
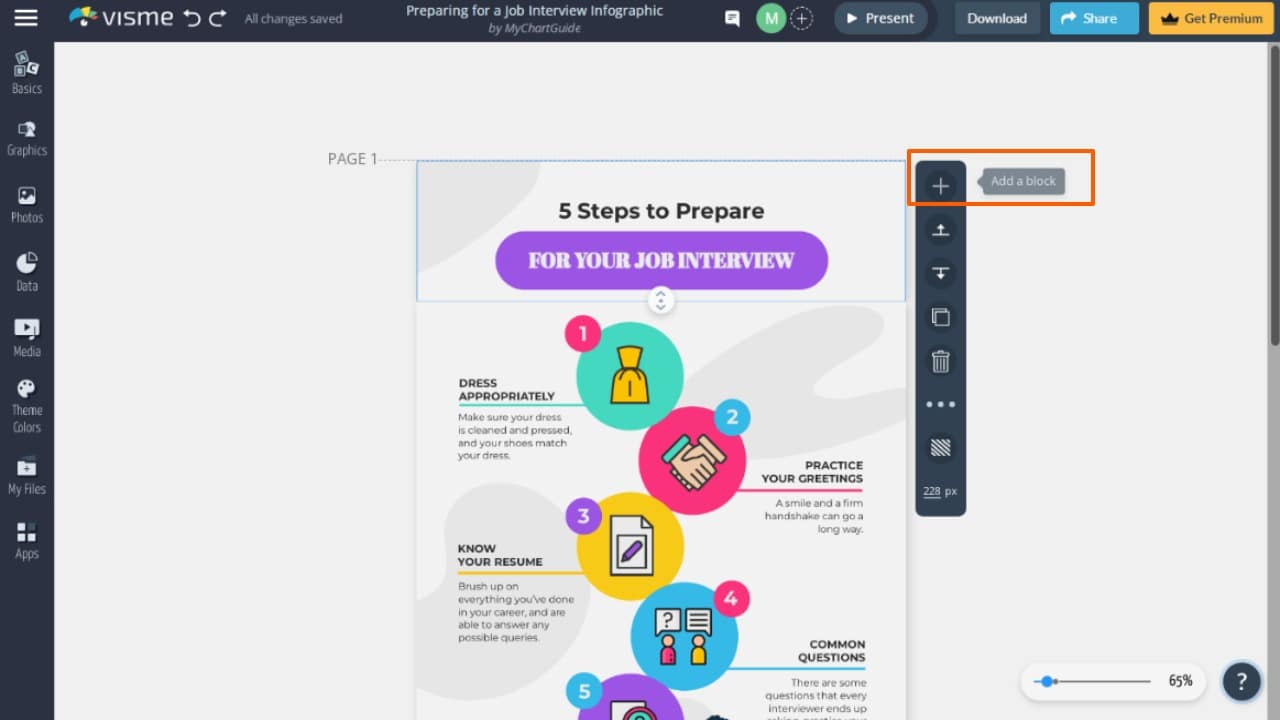
Adding new blocks or slides
If you’re working multi-page design, you will find the option to add a new block or page on the right side of the design area. Depending upon the type of template you’re working on, you may find the option to add a new block, new page, new slide, etc.
Preview and download your work
Once done creating the project, click on the “Present” button to preview your design in full screen.
Next to the Preview is the “Download” button, where you can download your project in various formats such as JPG, PNG, PDF, and more.
Besides the Download button is the “Share” button with which you can share your project’s link publicly on social media or privately with individuals and team members. Or, you can use the embed option to use the graphics on a webpage.
Giving a title and description to your project will make it discoverable on search engines.
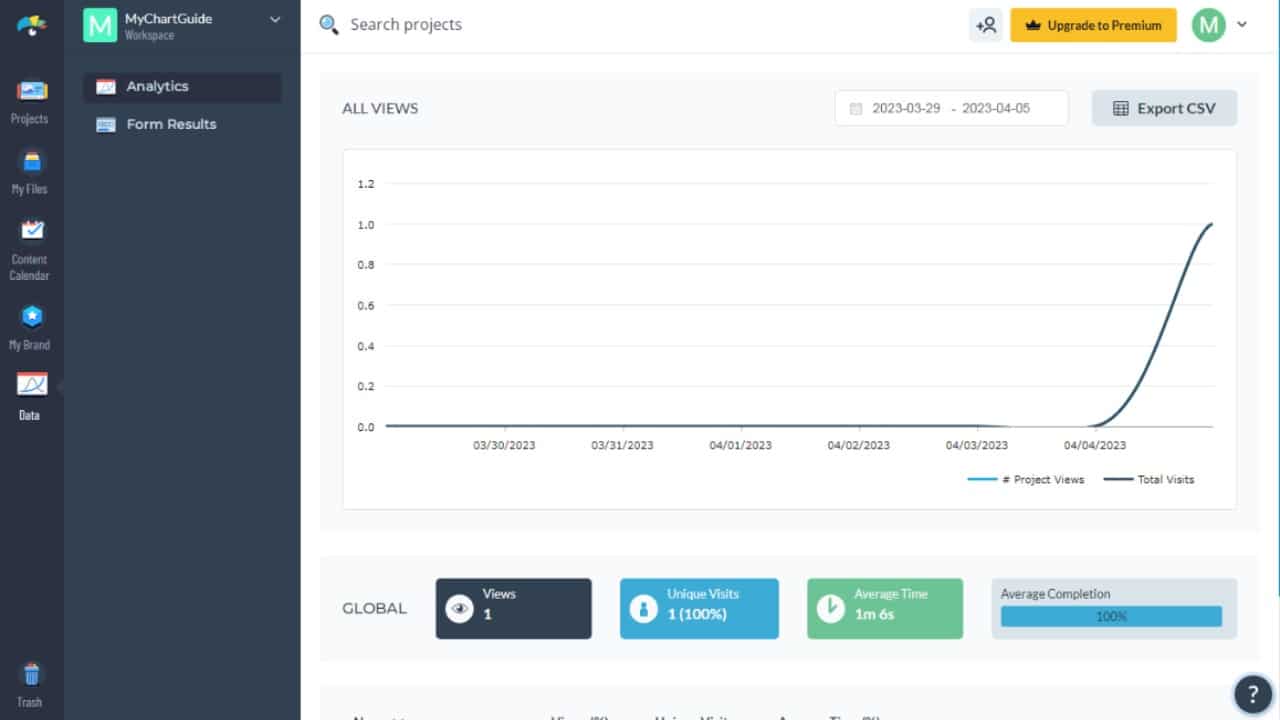
Analytics
Want to know how is your project performing?
Go to the dashboard, hover over the project, and click on the three dots in the lower right corner, and you’ll see the “Analytics” option there.
In the Analytics section, you’ll know the number of views, unique visitors, and the average time they spend on your work.
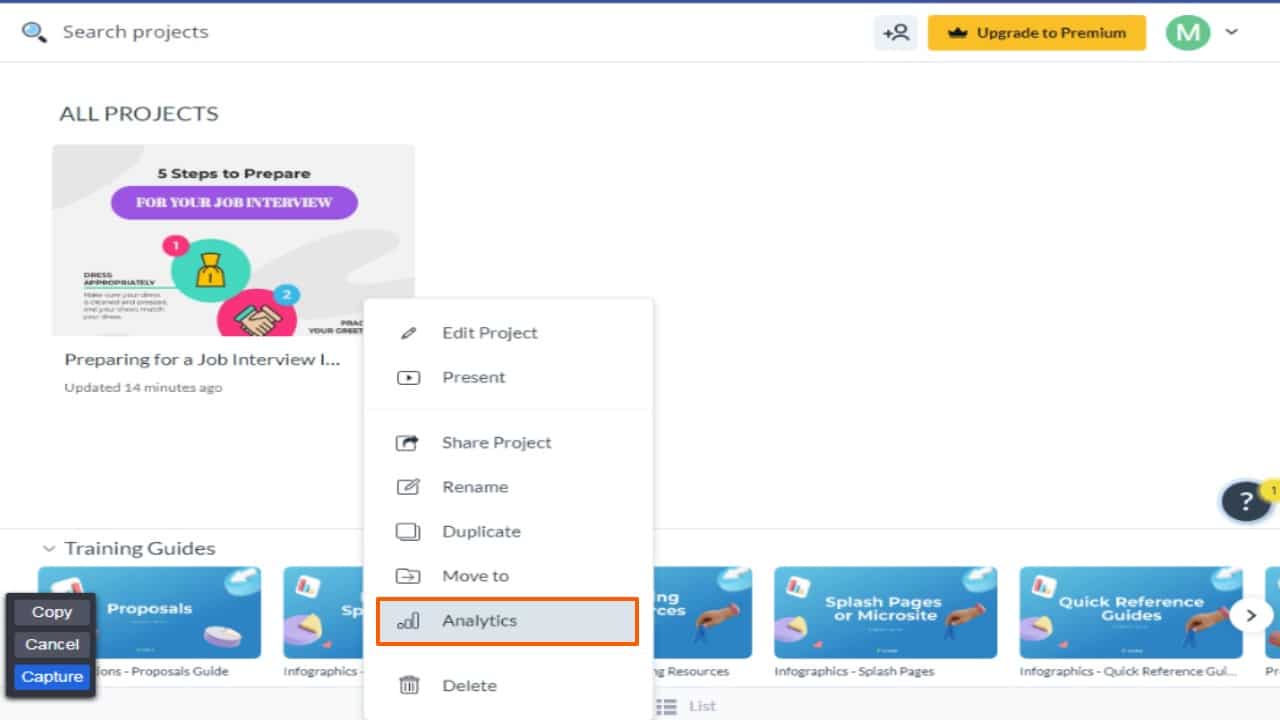
In the same menu, you can rename the project and move it to a different folder.
Visme pricing plans
Visme offers multiple pricing plans to suit everybody’s needs.
Free Plan
The pricing plan of Visme starts from zero dollars per month!
For people just testing the waters, there’s a free version where you can create unlimited presentations, infographics, printables, etc.
Obviously, the free version will have some limitations, like a storage limit of 100 MB and access to limited templates.
But still, it’s more than enough to create a few stunning graphics and determine whether this tool fits your need.
Starter Plan
The starter plan costs you around $12 per month (billed annually).
This plan offers 250 MB of storage, full access to templates and assets, and 24X7 email and chat support features.
In this plan, you can remove Visme branding from your graphic works.
Pro Plan
Pro plan costs around $25 per month (billed annually).
If you’re a small business owner, pro plan will be perfect for you. As it offers large storage capacity of 3GB, multiple downloading options such as HTML5, PPTX, and GIFs.
Moreover you get access to Brand Kit, Analytics, and various Integrations.
Visme for Teams
This is an enterprise-level plan that can be customized according to your need. This plan includes everything a Pro plan offers and much more, like 10-25GB storage per user, custom sub-domain, team collaboration, advanced third-party integrations, etc.
Upon purchasing this plan, Visme will offer you personalized training & onboarding.
The features of this plan don’t end here, hence you need to contact the Visme sales team to know more.
Education and non-profit plan
Apart from pricing plans for businesses, Visme has dedicated pricing plans for education and non-profits.
The student plan will cost around $40 per year, while the educator plan will cost around $60 per year.
For a non-profit, you get a 25% discount on the business plan. You need to send them an email to apply for the discount.
Visme Pros and Cons
Everything has its strengths and weaknesses, and online graphic design tools are no different. In this section, we tried to cover what we liked about Visme and what could be improved.
Pros
- Starting a design project from scratch is easy and straightforward.
- Visme offers a desktop version of the tool for people who want to work offline on their projects.
- Free and high-quality pre-built templates, stock images, videos, and audio files.
- It is more affordable than competitors like Canva or other professional graphic designing tools like Adobe Photoshop.
- Animate a single element or the whole block.
- Sharable branded infographics, charts, graphs, and presentations that others can view and comment on.
- Analytics for every project.
Cons
- Little storage on low-pricing plans.
- Some useful file formats are only accessible with expensive plans.
Final thoughts
Now comes the main question — Is Visme worth it?
The answer is — Absolutely! Especially when you’re not a professional graphic designer and can’t hire one but want to create and publish high-quality content on your website and social media.
Often you won’t even need to create graphics from scratch; you’ll find templates that can be used with some alterations.
Overall it’s a powerful, easy-to-use, and budget-friendly designing tool. And the best part is it’s a free plan that offers most of the features so that you can decide by yourself whether it’s worth spending money on the premium plans.