Tables have always been a go-to format for presenting structured data. But in today’s fast-paced digital workflows, static tables fall short. Professionals now demand tools that let them build dynamic, interactive, and beautifully styled tables for reports, dashboards, infographics, and websites.
In 2025, table chart makers come packed with features like conditional formatting, live data syncing, responsive design, export versatility, and more. Whether you’re a product manager displaying feature comparisons, a financial analyst sharing quarterly data, or a content creator adding visual tables to blog posts—having the right tool is a game-changer.
In this guide, we’ll explore the top table chart makers for 2025 that help transform dry rows and columns into engaging and easily digestible visuals. Get ready to upgrade your data presentation with tools that make tables not just functional, but impressive.
1. Visme – One of the Best Table Chart Makers for 2025

Visme stands out as a top table chart maker in 2025, offering a perfect balance between functionality and design. Whether you’re managing marketing data, building reports, or creating dashboards, Visme helps you present your information with clarity and impact.
With Visme’s intuitive drag-and-drop table editor, you can add rows, columns, and data points effortlessly—no spreadsheet experience required. Start from a fully customizable template, or build your table from scratch. Every element—from fonts and colors to cell borders and icons—can be tailored to match your brand or visual theme.
What truly sets Visme apart is its interactive capabilities. Unlike basic tables, Visme lets you add hover effects, clickable links, tooltips, and even live-updating data, making your charts perfect for dynamic presentations or embedded dashboards.
Teams benefit from real-time collaboration features, allowing users to comment, annotate, and co-edit tables, while administrators can oversee progress through workflow tools. Whether you’re building a project summary or visualizing research insights, Visme ensures your table is both informative and professional.
Key Features:
- Drag-and-drop editor for easy table creation
- Full control over fonts, colors, borders, and layout
- Interactive elements like tooltips, clickable links, and live data
- Dozens of ready-made table templates
- Seamless sharing and export (PNG, JPG, PDF, or online)
- Brand integration with custom fonts and colors
- Real-time collaboration with team management tools
Pros:
- Extremely user-friendly and accessible to non-designers
- Fully customizable and brandable
- Interactive table options add depth and engagement
- Strong collaboration features for teams
- Variety of export options and web embedding
Cons:
- Some advanced features require a paid plan
- Not designed for heavy statistical analysis or complex formulas
Visme is ideal for users who want to create beautiful, functional tables without dealing with complex spreadsheet tools. Its design-centric approach, interactive features, and ease of use make it a go-to table chart maker for professionals across marketing, education, business, and design in 2025.
2. Edraw Max Table Maker
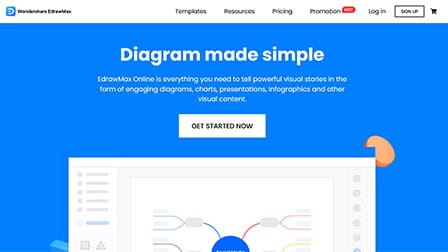
Garnering the trust of more than 25 million users, and being highly favoured by leading brands, like Sony, Toyota, Amazon, Deloitte, among many others, Edraw Max Table Maker is a popular table chart maker.
This application allows its logged-in users to fabricate visually stunning table charts for free through easy-to-edit, freely customizable templates and symbols. One can also easily embed and add tables on infographics, reports, presentations, and more than 280 types of supported diagrams.
What makes Edraw Max a largely preferred option for making table charts is its ease of team collaboration that helps all the team members to work on the same page by setting file access rights and file permissions.
The users can also play around different tables to cater to every need, such as focus, precision and comparison. Once done, the resulting infographics can be effortlessly presented and printed as well as exported to different formats.
Pros:
- Diverse functionality
- Very affordable pricing
- Supports a whole gamut of chart creation tools
Cons:
- Lacks tablet support
- A little overdramatic for some users
3. Creately
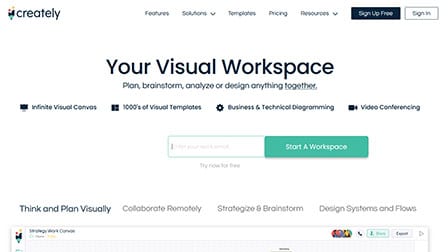
Gaining the trust of more than 5 million users worldwide, Creately has seamlessly placed itself among the best table chart makers of 2025.
This affordable diagramming tool assists you in organizing your data effortlessly and can devise visually impacting, easy as well as complex table charts. It comes with a spread of professionally-made templates to facilitate the fabrication of the charts in a matter of few minutes.
The most superlative streak of using this online platform is that it lays major emphasis on the personalization of table charts with thousands of icons and various specialized standardized shape libraries.
Creately also renders the benefits of adding important details to visuals through preset styling options and the context toolbar.
Other than in-app video conferencing and seamless team collaboration, it allows the copy-paste of graphical content right from phone galleries or a simple drag and drop of the in-built Google searched images.
Pros:
- Huge library of templates
- Ideal for creating complex flowcharts
- Intuitive layout
Cons:
- Lags sometimes
- Navigating the canvas is quite complicated
4. Piktochart

Used by 11+ million users for their chart making needs, Piktochart is designed to help creators master different forms of designing needs in no time at all.
With Piktochart, creating professional-looking design takes a few minutes.
With Piktochart Visual, users can also integrate the charts into their current workflow in either PNG or PDF formats without any hassle at all. The best part is that the software allows the users to turn into a clear and catchy visual in no time at all.
Lastly, creating table charts on the platform is not only seamless but offers you access to a variety of other images and infographics, including infographics, posters and even lets you convert your videos into text format in no time at all.
Piktochart comes with different types of pricing plans, ranging from Pro, Enterprise, Education and Non-profit. It all fizzles down to what you think would be a better option for you and your charting needs.
Pros:
- Very easy to use
- Strict design guidelines
- Supports remote collaboration
Cons:
- Free version is quite limited
- Doesn’t support a few languages
5. Infogram

Powered with advanced features and some pre-designed table charts made by its esteemed users, Infogram can be recognized for its first-class reviews and ratings.
The designed tables from the users range from indexes to trackers, pricing sheets to company documents, review sheets to various other comparative lists to bring out easy data visualization and management. These designs can help the users to draw inspiration for their table charts.
The incredible feature that Infogram poses on its registered users is the simplicity of creativity that is needed to design and edit the table charts. Infogram lets free access to login into the application and begins with making tables which can be loaded with features and customized as per one’s choice.
This tool especially provides an attractive palette of colors. MSN, TomTom and Euronews are few of the top companies deploying this application to cater to tables incorporated for crucial corporate use.
Pros:
- Intuitive and friendly UI
- Wide range of visualization
- Great compatibility
Cons:
- Not ideal for complex visualization
- Requires user to remain online to use it
6. RapidTables
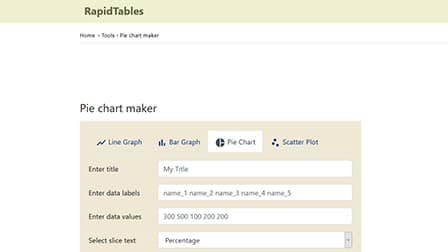
Finding relevant and simple table chart makers isn’t as complicated as you think. Although there are quite a few different ones available on the internet, RapidTables somehow takes the cake with its interactive yet minimalistic user interface.
Creating a table chart on this platform takes less than a minute and the fast-loading page and processing of the data is what makes it such a great option to consider.
First look at this platform might seem underwhelming but the platform packs in all the important features and functionalities that you’d need to streamline your user experience.
Once the table chart is created, the platform also enables you to convert it into PDF or an image file and save it to your device for future reference. Also, this versatile platform also hosts a variety of other charting formats, including line graph, pie chart, bar graph, etc.
Pros:
- Simple UI and functionality
- Supports different chart formats
- Easy to download options
Cons:
- Too simple for some users
- Not great for complex visualization
7. Canva

An online, free of cost tool, Canva has witnessed wide popularity across numerous Top tier firms across the world.
This can be owed to the creation of some of the attractive and feature-rich table charts in this application with the help of an extensive variety of professional templates.
Along with this, Canva is simple to use and is structured with an interactive workspace that is easy to navigate in order to achieve the customization of the charts in a few seconds.
The table charts can be enhanced with the choice of over hundreds of stock images. They can also be modified for their text labels and boxes particularly for titles and headings to highlight important data by a simple click of the mouse. Another best part is that Canva allows the insertion of hyperlinks into the charts while sharing them as PDF files or embedding them across websites and e-mails.
Pros:
- Extremely easy to use
- Free plan is pretty resourceful
- Easy to collaborate
Cons:
- Formats for output is quite limited
- Doesn’t have offline mode
8. Xara Table Maker

Developed to help users create functional and attractive table chat in under a minute, Xara Table Maker is there to save your designing time and streamline your workflow.
Featuring an intuitive interface, the table chart maker comes with amazing collaboration tools and free table templates to kickstart your workflow.
What’s great about Xara Table Maker is that it supports your branding by maintaining standard table templates that align with your brand’s aesthetics. Furthermore, the copy and paste functions are time-saving and very easy to implement. It also has the drag and drop editor function to make your life a lot easier.
Ideal for data organization, Xara Table Maker sorts all your data and piles them into individual sections so its easier for you to come back and compare values. All the available templates are customizable, enabling you to create a table tailored to your project in question.
Trusted by 40,000+ brands and businesses, Xara is a versatile table chart maker you won’t regret spending your time on.
Also, for the users who are skeptical or on the fence about using this platform, it comes with 14-days free trial. You can sign up, use the features and cancel your payment information if the chart maker isn’t to your liking.
Pros:
- Easy to learn software
- User-friendly UI
- Consistently improving with new features
Cons:
- Permanent pop-ups can disrupt usage
- Not that affordable
9. Google Sheets
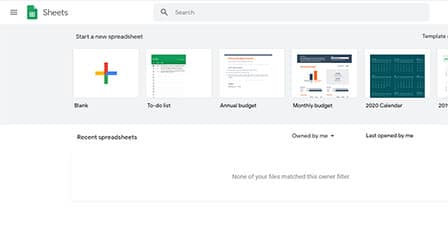
A spreadsheet oriented, Google parented application program, Google Sheets can be operated completely free of cost to create, edit and publish table charts with real-time inputs and analysis.
It pronounces security and controls access rights for various functions with live access on the same sheet with multiple users. It provides browsing access through tablets, mobiles or desktops screens.
The tables can be elaborated with colors and the users can begin making the tables by selectively picking from a stunning range of templates in the Explore panel to minimize the need of playing with graphics and designs.
The table charts get auto-updated and saved seamlessly and the revision history feature enlists all the changes and edits.
This application works perfectly with Microsoft Excel for conversion and editing functions. Once done, the table charts can be either published as links or inserted in the form of HTML codes in blogs and websites.
Pros:
- Works with other Google Workspace apps
- Amazing collaboration tools
- Supports commenting and suggestions
Cons:
- Doesn’t have offline mode
- Not as advanced as Excel
10. PollUnit
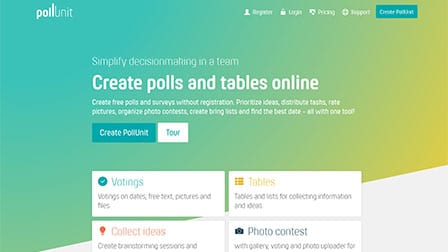
PollUnit is a web-based application that generates free online tables that can be defined and magnified in seconds.
The table charts are used to collect and represent data to enable a better understanding of ideas or information in the form of lists.
Once registered and logged in into the account, a user can invite several participants who do not need an account or credentials. The participants can enter text onto the tables and are permitted to edit just one of the table row, accessed by them in the chart.
Using the column attribute, column type » Number «, the user can minimize the data entries of participants to numbers so that it is easily convenient to know the total count.
One of the promising factors of this table generator is that it automatically makes calculations of averages and additions of the entries. The tables can be easily published on websites.
Pros:
- Doesn’t require registration
- Supports different types of themes
- Has calendar integration
Cons:
- Not optimal for slow processing devices
- Collaboration features are limited
Related:
- Top 10 Best Online Chart Makers
- Top 10 Best Organizational Chart Tools
- Top 10 Best Flowchart Makers
- The 10 Best Pie Chart Makers
- Top 10 Best Bar Chart Maker
The End Note
Overlooking the relevancy of the chart making applications in the text above, all of them ensure and assert feasible and rapid solutions for table chart generation and their enhancement.
Along with offering numerous attractive looking templates and beautification properties like colors, resizing options, fonts, borders, and dimension modifiers, they are inbuilt with interactive work-spaces.
Some tools provide advanced integrated systems and incorporate programming structures to build and carry out implementations on the tables.
Google Sheets can be recognized as the most well-known table generating spreadsheet program among the freely available applications.
Visme and Infogram extend ease of use with animated customization attributes and can be witnessed to be deployed across top organizations. PollUnit can be also approached to be among the best table chart makers in 2025 for their uniqueness of functionality which is specific to these chart makers.
I just want a very, very simple table maker, such as one would use to help pack for a trip, or lay out your hotels and flights, or plan a class picnic, nothing in colors, nothing in multiple templates needed.
All such complexities slow down learning and add inefficiency of result.