A complete guide on Drill Charts: what, why, and how
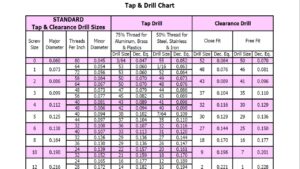
Drill charts are referred to when drilling holes in materials like wood, metal, concrete etc. If you are a drilling expert, you probably already know the use and importance of drill charts in your work. But if you are just getting started in this field or pursuing it as a hobby, this guide will help … Read more