Quality control is critical for any industry that aims to deliver consistent and high-quality products or services. Keeping a strict eye on quality control ensures that the results meet customers’ expectations and comply with industry standards.
One among many tools and techniques available for quality control is — Control Charts.
If you are new to control charts, don’t worry. This article is just for you, where you’ll learn about control charts, their importance, their various components, their benefits and much more.
All in all, after reading this comprehensive guide, any and every doubt regarding control charts will be cleared.
So, shall we start?
Contents
What are Control Charts?
Control charts are graphical charts used to control quality. Some people also call them Schmidt charts or process-behavior charts.
Control charts help organizations monitor and control processes over time.
These charts were first introduced by Walter A. Shewart in the mid-20s during his work at Bell Labs.
Why are Control Charts important?
Why do we use control charts in the first place? This is an obvious question that might arise in your mind.
Well, there are multiple reasons that make them essential for businesses:
- Identifying process stability: It helps determine whether an ongoing process is stable or showing unusual variations.
- Detecting trends and anomalies: It is used to record trends, shifts, and/or anomalies in data, which helps us identify the root of problems.
- For continuous improvement: Businesses get meaningful insights that encourage continuous improvement of the system.
Various Componеnts of Control Charts
Several components come together to make a control chart in order to provide a clear picture of process behavior. What are those components? Let’s take a look:
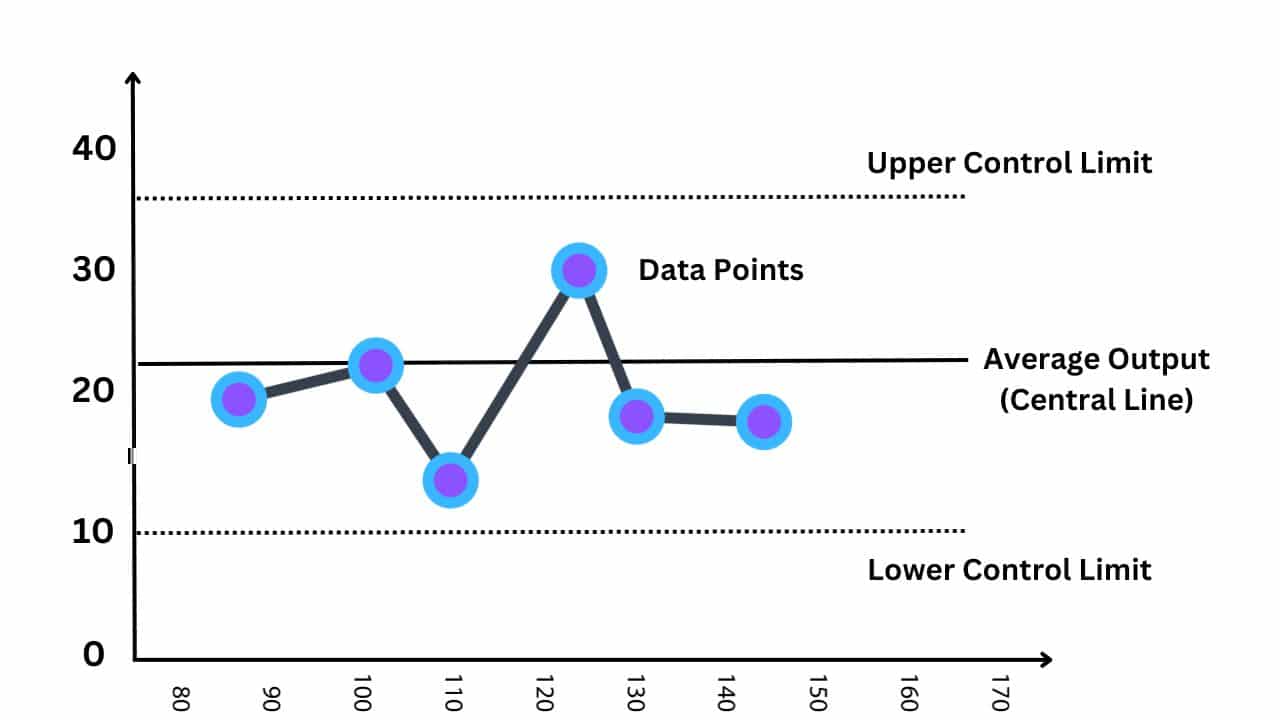
- Data points: Data points are the base of control charts. They tell us the measurements or observations that the chart has collected over time.
- Central line: The central line shows the average or mean of the process. This is usually a horizontal line but may vary according to need. While reading the control chart, this line acts as the point of reference to assess the performance of the process.
- Higher and lower control limits: Higher and lower control limits are lines above and below the central line. These lines act as boundaries. The purpose of these lines is to define the acceptable range of variations in the process. If you see your process going beyond these lines, there might be some problem that needs to be solved. Higher and lower limits are calculated based on historical data and the level of control.
Now that we know what a control chart is and what its components are let’s learn how to interpret it.
How to interpret Control Charts?
What’s the point of looking at the control chart if it doesn’t make any sense to you? Hence, you need to know how to interpret a control chart:
- Data points in control limits: If your data points are within the control limit, it shows that the process is under control, and a little variation is just some common errors. This is a good sign, which means your process is stable.
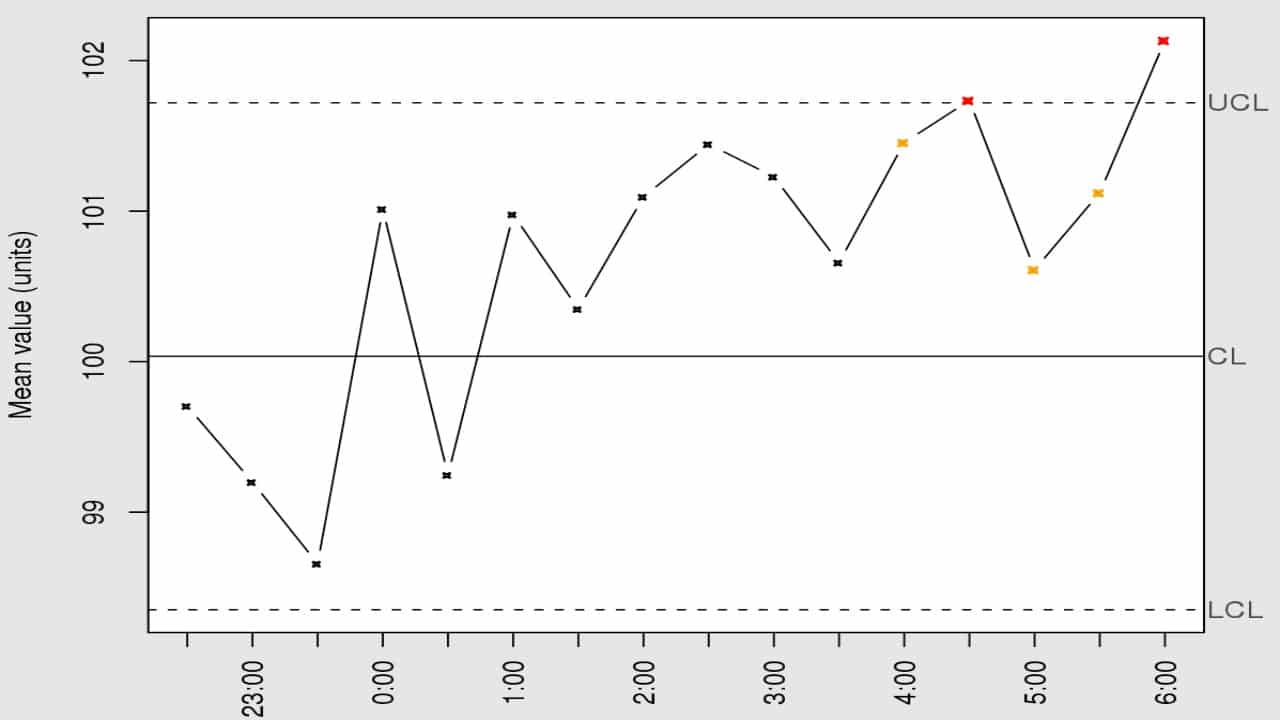
- Data points falling outside higher and lower limits: If the data points are falling significantly outside of control limits, it signals a problem. These points going beyond the limits are termed special cause variations and require immediate attention. Data points outside control limits clearly indicate that something unusual is going on in the process.
- Trends and patterns: Apart from process stability, control charts also reveal trends and patterns within the process. For example, if there’s a steady increase or decrease in data points, it’s an indication of a process shift. Early identification of these tasks can help you prevent quality issues.
- Consistency and predictability: Control charts are a visual presentation of the consistency and predictability of processes. If you notice a stable process with most data points near the central line, it means that the process is operating as expected.
Variation types in Control Charts
While implementing control charts in your processes, you must also understand their variation types.
- Common cause variation: This is the default variation of the process and often occurs. Common cause variation arises from factors that are consistent and constant over time. This could be natural variations in materials or equipment.
- Special cause variation: It occurs when something unusual happens in the process. This variation is not expected from the process and could result from a machine malfunction, operator error, or any other unknown, unexpected event.
Make sure that you fully understand the difference between both types of variations for effective quality control. Control charts will help you notice the specific cause variation when they occur in the process so that you can take corrective actions on time.
Benefits of Control Charts
Let’s move on to discussing the many advantages associated with control charts as a quality control tool. In this section, we will explain their value.
- Early problem identification: Control charts provide an early indicator of any process deviations that require corrective action before they escalate and cost time and resources to remedy.
- Constant Improvement: Control charts help analyze product data over time, identify areas for enhancement and implement necessary changes that make product or service quality continually better.
- Data-Driven Decision-Making: These charts allow for data-driven decision-making. Statistical analysis-based decisions give more reliable results than gut feelings alone.
- Increased customer satisfaction: Implementing quality controls through control charts results in higher customer satisfaction and loyalty as they can trust that your products or services meet their expectations.
- Cost Savings: Organizations can save a substantial sum over time by using control charts to minimize variations and cut costs, thereby saving on rework, customer complaints and production expenses. With proper monitoring systems in place, organizations can avoid making costly errors.
While using control charts, keep the following mistakes in mind in order to avoid common errors:
- Reacting Too Quickly to Every Data Point: One data point that falls outside your control limit shouldn’t be seen as a major cause for alarm; some variability can occur from common causes, and overreacting should be avoided at all costs; instead, conduct thorough investigations before taking action.
- Failing to update control charts: Staying current with your process performance requires regularly updating your control chart with fresh information; otherwise, it risks becoming outdated over time. Failing to do this could result in incorrect or outdated data being displayed.
- Relying solely on control charts: Control charts can be most effectively utilized when used alongside other quality control tools and methodologies. Don’t rely solely on them; augment them with root-cause analysis or other approaches.
- Failure to Recognize Forming Patterns in Control Charts: Failing to recognize formation patterns can result in missed opportunities for process improvement. Always remain alert and look out for actionable insights that could improve the process.
- Failing to train Your Team: For effective quality control, training your team should cover reading and interpreting control charts. Therefore, proper education must be provided.
Summary
From components to the interpretation of control charts, we have covered all the important topics in this comprehensive article.
Further, we discussed how control charts offer a powerful way to track and improve processes to achieve consistent quality and customer satisfaction.
Organizations using control charts observe progress in their quality control efforts. Therefore, you are also advised to use it in your business.
However, while using control charts, remember that quality control is a process that requires continuous effort; it’s not an on-time activity.