How to make an Organizational Chart in Excel?
The article scripted below describes the use and operation of Microsoft Excel in creating and designing colorful, basic, interactive organizational charts.
ArchiMate is a diagramming tool targeted to help support architectures in drawing better visual representation of their ideas and thoughts with a unique modelling language.
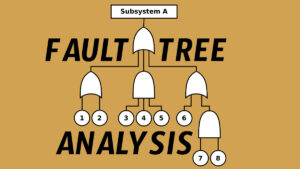
Fault Tree Analysis is a type of diagrammatic representation which helps find the loopholes in the system to further minimise the errors and find alternative ways to cope with the same.
A pedigree chart is a visual chart or a diagram that shows the chances of a certain phenotype in an organism also its ancestors covering one generation at a time. The pedigree chart basically shows the family tree of a particular human or any other living organism. A pedigree chart is often used to navigate … Read more
This article explains the demand for histograms and how to create histograms in Microsoft Excel and simultaneously enhance them with customization features.
Looking to turn raw numbers into engaging visuals? Discover the best bar chart makers of 2025 that simplify data visualization with powerful features, beautiful templates, and easy customization. Whether you’re a student, marketer, or business analyst, these tools help you create professional bar charts in minutes—no design skills required.
Discover the best pie chart makers of 2025 to effortlessly transform your data into engaging, insightful visuals. From live data syncing to drag-and-drop customization, these tools offer powerful features for professionals, educators, and marketers alike. Make your charts more compelling—without the design hassle.
Stay on top of deadlines with the best Gantt chart makers of 2025. These tools help visualize tasks, track progress, and boost team collaboration. From real-time updates to customizable templates, find the perfect solution to manage any project efficiently and keep everything on schedule with ease and clarity.
If you are wondering to make a pie chart using Excel, there are a few steps that one needs to follow to get the desired results in no time at all.
PESTLE, PESTEL or PEST analysis makes use of a wide range of tools that help in assessing the risks and impacts that the environment and external factors play on the overall outcome of the processes involved in an organization.