The business world is growing at a fast pace. And creativity, productivity, and effective communication have become the essential ingredients for success today. To unlock these qualities, many professionals are turning to a powerful tool: Mind mapping.
Mind mapping, when combined with visual elements such as charts, graphs, diagrams, and drawing tools, has the potential to revolutionize the way we generate ideas, organize thoughts, and communicate concepts in the business realm.
In this article, we’re going to explore how you can enhance creativity, boost productivity, and facilitate better communication in various business contexts using mind mapping and visual elements.
Contents
Understanding mind mapping
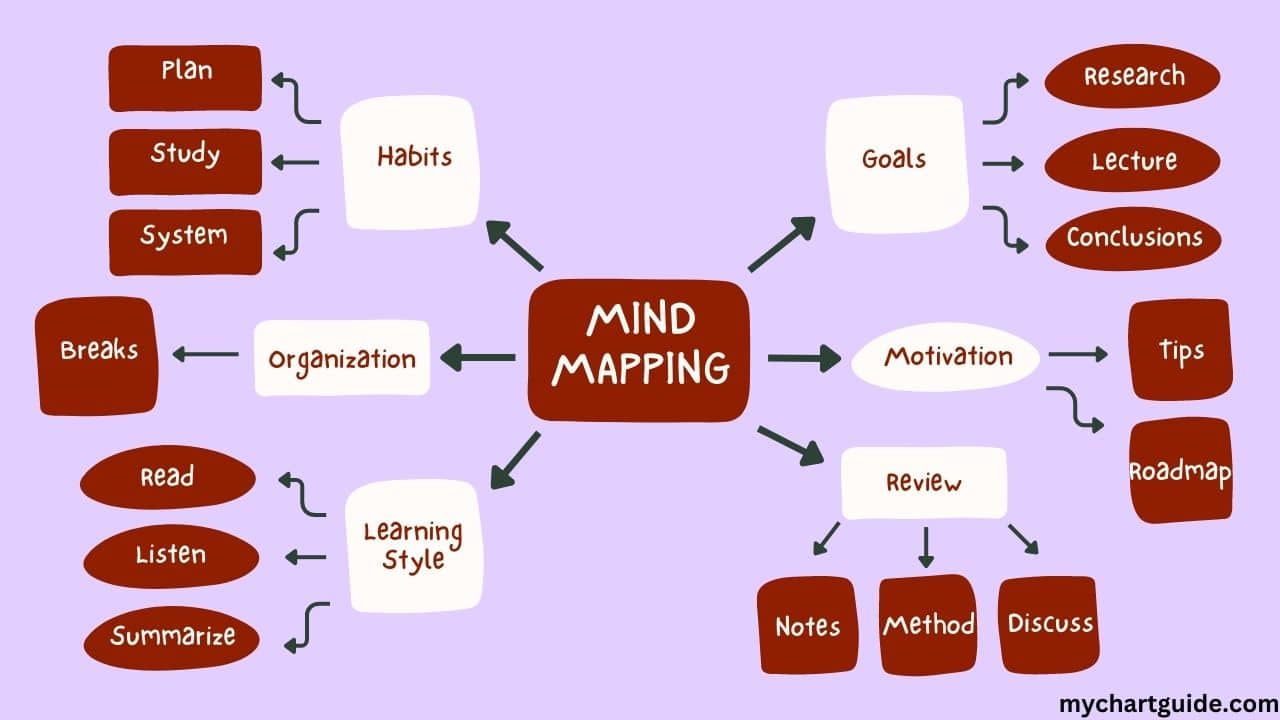
Mind mapping is a technique that involves visually organizing information and ideas in a hierarchical manner. It originated from the work of Tony Buzan, a psychologist, and author, who recognized the brain’s natural preference for associative thinking and nonlinear patterns.
A mind map typically starts with a central idea or concept, represented by a node, and branches out to subtopics and related ideas. This visual representation helps to stimulate creativity, promote connections between ideas, and aid in information retention.
Enhancing creativity with mind mapping and visual elements

Stimulating idea generation
Mind mapping provides a fertile ground for idea generation. By using keywords and branches, individuals can explore new concepts, link seemingly unrelated ideas, and uncover innovative solutions to challenges.
Furthermore, incorporating visual elements into mind maps can ignite creativity by engaging the visual senses and allowing for more diverse thinking patterns.
When we engage in mind mapping, we tap into the power of our brain’s associative thinking. By visually mapping out our thoughts and ideas, we create a network of connections that stimulate our creativity.
Instead of linear thinking, where one idea leads to another in a logical sequence, mind mapping encourages a more organic and nonlinear approach. This freestyle brainstorming allows us to explore different pathways, make unexpected connections, and discover novel insights.
The visual nature of mind maps further enhances the creative process. By incorporating colors, symbols, and images, we activate the right hemisphere of our brain, which is responsible for creativity and intuition.
This multi-sensory experience not only stimulates our imagination but also helps us think outside the box and generate unconventional ideas.
Visualizing complex concepts and relationships
In the business world, complex concepts and relationships can often be difficult to grasp. Mind maps, supplemented with charts, graphs, and diagrams, offer a visual representation that simplifies and clarifies intricate ideas.
Flowcharts can illustrate processes, graphs can depict data trends, and diagrams can show relationships between different components. These visual representations provide a holistic understanding, facilitating deeper insights and encouraging creative problem-solving.
Complexity is a common challenge in business, especially when dealing with intricate systems, processes, or strategies. Mind mapping, combined with visual elements, offers a solution to this problem.
By breaking down complex concepts into manageable chunks and representing them visually, we gain a clearer understanding of the underlying structure and relationships.
Flowcharts, for example, are effective tools for visualizing processes. They provide a step-by-step depiction of how tasks or activities flow, allowing us to identify bottlenecks, inefficiencies, or areas for improvement. With a visual overview of the process, we can analyze and optimize it for greater productivity and effectiveness.
Graphs and charts are invaluable when dealing with data. Instead of drowning in spreadsheets and numbers, we can transform raw data into meaningful visual representations.
Bar charts, line graphs, and pie charts are just a few examples of how data can be visualized to uncover trends, patterns, and insights. This visual approach not only simplifies complex data but also facilitates data-driven decision-making.
Diagrams, on the other hand, help us understand relationships and connections. Whether it’s mapping out organizational structures, illustrating the flow of information in a network, or visualizing the components of a system, diagrams provide a visual framework for comprehending relationships. By seeing the bigger picture, we can identify opportunities, potential risks, and areas for optimization.
Enhancing communication through visual storytelling

Effective communication is vital in business settings, whether it involves presenting ideas to stakeholders, explaining strategies to teams, or engaging clients. Mind maps, coupled with visual storytelling techniques, offer a compelling way to communicate complex information.
By creating visual narratives and incorporating captivating visuals, individuals can convey ideas in a memorable and engaging manner, ensuring effective communication and alignment among stakeholders.
Traditional methods of communication, such as lengthy reports or PowerPoint presentations filled with bullet points, often fail to capture attention and engage the audience.
In contrast, visual storytelling has the power to captivate and resonate with people on a deeper level. It taps into our innate ability to process visuals faster and retain information better.
Mind maps provide a structure for organizing thoughts and ideas, making them an ideal framework for visual storytelling. By arranging key concepts, subtopics, and supporting details in a visual hierarchy, we create a narrative flow that guides the audience through the story we want to tell.
Visual elements, such as images, icons, and diagrams, further enhance the storytelling experience. They add visual interest, provide context, and convey emotions or key messages.
For example, incorporating relevant images can evoke an emotional response, helping to establish a connection with the audience and make the information more memorable.
In addition to enhancing engagement, visual storytelling also facilitates better comprehension and retention of information. Studies have shown that visual aids when used in conjunction with verbal communication, can improve information recall and understanding.
Boosting productivity with mind mapping and visual elements

Planning and organizing tasks
Mind maps serve as excellent tools for planning and organizing tasks. By visually mapping out project roadmaps, timelines, and task dependencies, individuals gain a clear overview of the project’s scope and progression.
Furthermore, incorporating charts and diagrams for resource allocation and task management helps streamline workflows, ensuring efficient and effective utilization of resources.
Project planning is a critical stage in any business endeavor. Without a clear roadmap and well-defined tasks, projects can easily veer off track and result in wasted time and resources. Mind maps provide a visual representation of the project, outlining key milestones, deliverables, and dependencies.
By breaking down the project into manageable tasks and assigning them to team members, mind maps facilitate effective resource allocation and task management. The visual nature of mind maps allows everyone involved to see the big picture while also understanding their specific role and responsibilities.
Charts and diagrams, integrated into the mind map, provide additional clarity and structure. Gantt charts, for example, offer a visual representation of project timelines, showing the start and end dates of tasks, as well as their inter-dependencies.
This visual depiction enables project managers to identify potential bottlenecks or resource conflicts, allowing for timely adjustments to keep the project on track.
Resource allocation is another crucial aspect of project management. By incorporating diagrams or graphs to visualize resource distribution, businesses can ensure optimal utilization of personnel, equipment, or budget.
This visual approach not only helps avoid over-allocation or under-utilization but also facilitates decision-making when reallocating resources to address changing project needs.
Streamlining information management and analysis
Managing and analyzing vast amounts of data in today’s information-driven business landscape is crucial.
Mind mapping allows individuals to gather, categorize, and synthesize information effectively. Visual elements such as diagrams, charts, and graphs can condense complex data into easily digestible visuals, aiding in data analysis and facilitating informed decision-making. Additionally, creating visual dashboards and reports enhances data visualization.
Information overload is a common challenge in the digital age. With the abundance of data available, businesses need effective strategies for managing and making sense of information.
Mind mapping provides a structured approach to gathering and organizing data, ensuring it is readily accessible and easy to navigate.
By using mind maps as a framework, individuals can categorize and link related information, creating a visual representation of knowledge that facilitates understanding and retrieval.
This method allows for efficient information management, as the visual structure of the mind map helps identify gaps in knowledge or areas that require further exploration.
Visual dashboards and reports take data visualization to the next level. By integrating visual elements into interactive dashboards, businesses can monitor key performance indicators, track progress, and identify areas that require attention.
Visual reports, on the other hand, offer a concise and visually appealing way to communicate complex information to stakeholders, enabling them to grasp key insights quickly.
Facilitating decision-making processes
Mind mapping, combined with visual tools like decision trees and matrices, provides a structured framework for evaluating options and assessing potential outcomes.
Drawing tools can be utilized to visually represent different scenarios and collaborate in real time, enabling teams to make well-informed decisions efficiently.
Decision-making is often a complex and multifaceted process. It involves considering various options, weighing pros and cons, and anticipating potential outcomes.
Mind mapping offers a visual framework for organizing and evaluating these decision-making factors, making the process more structured and systematic.
Decision trees, for instance, provide a visual representation of choices, potential outcomes, and associated probabilities. By mapping out different decision paths, businesses can assess the risks and rewards of each option, leading to more informed decisions.
While, decision matrices allow for the comparison and evaluation of multiple criteria against different alternatives, enabling businesses to objectively assess options based on predetermined criteria.
Drawing tools within mind mapping software allow teams to collaboratively visualize different scenarios and conduct real-time brainstorming sessions.
Whether it’s sketching out potential product designs, mapping out customer journey maps, or outlining marketing strategies, teams can work together to generate ideas, evaluate options, and arrive at consensus more efficiently.
Techniques and tools for effective mind mapping and visualization
Choosing the right software and tools for business applications
When it comes to mind mapping and visualization, selecting the appropriate software and tools is also an important thing to do. There are various mind-mapping software options available, each with its unique features and functionalities.
Additionally, graphic design tools can be utilized to create professional visuals that align with the brand and enhance communication.
When choosing mind mapping software, consider factors such as ease of use, compatibility with different devices, collaboration features, and integration capabilities.
Some popular mind-mapping tools include MindMeister, XMind, and Ayoa. These tools offer a range of features, from basic mind-mapping functionalities to advanced collaboration and integration options.
For visual design elements, graphic design tools like Adobe Creative Cloud, Canva, or Lucidchart can be used to create appealing visuals that align with your business branding and communication style.
These tools provide pre-designed templates, customizable elements, and a user-friendly interface, making it easier for even non-designers to create professional visuals.
Design Principles for impactful visual representation
Effective visual representation requires adherence to design principles. Colors, fonts, and layouts should be used strategically to convey information effectively.
Incorporating icons, images, and diagrams in a visually appealing manner not only enhances understanding but also adds a touch of creativity and professionalism.
When incorporating visual elements, consider the principles of visual design:
- Color: Use colors strategically to evoke specific emotions or highlight important information. Consider the color psychology and choose a color palette that aligns with your brand identity.
- Fonts: Select appropriate fonts that are legible and reflect the tone and style of your business. Avoid using too many fonts or styles, as it can create visual clutter.
- Layout: Arrange visual elements in a logical and organized manner. Ensure proper spacing and hierarchy to guide the viewer’s eye and facilitate understanding.
- Icons and Images: Use relevant icons and images to visually represent concepts or ideas. Icons can enhance understanding and add visual interest, while images can evoke emotions and provide context.
- Diagrams and Charts: When creating diagrams or charts, ensure clarity and simplicity. Use appropriate labels, legends, and scales to make the information easily interpretable.
Conclusion
Mind mapping and visual elements have the power to transform the way we generate ideas, organize information, and communicate in the business world.
By harnessing the potential of mind-mapping techniques and incorporating visual tools such as charts, graphs, diagrams, and drawing tools, businesses can enhance creativity, boost productivity, and facilitate effective communication.
The creative potential of mind mapping lies in its ability to stimulate idea generation, encourage nonlinear thinking, and foster connections between seemingly unrelated concepts.
Visual elements enhance the mind-mapping process by engaging the visual senses, simplifying complex information, and facilitating comprehension.
By embracing the power of mind mapping and visual elements, businesses can unlock their creative potential, streamline processes, and communicate ideas more effectively.