The Ultimate Guide to Concept Maps: What They Are, How to Use Them, and How to Make One
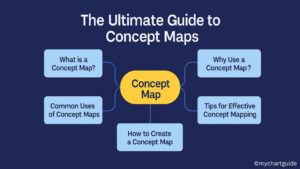
Discover everything you need to know about concept maps—what they are, their benefits, how to use them in education, business, and beyond, plus a step-by-step guide to creating one.