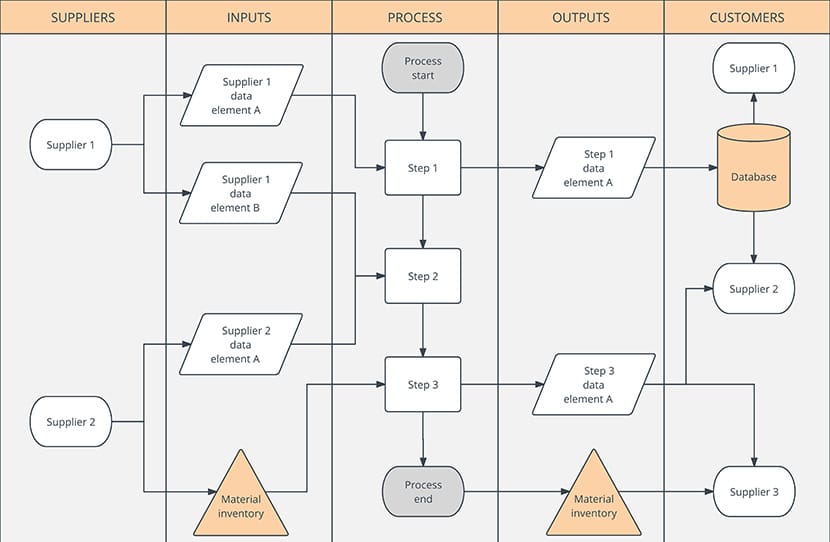
If you’re involved in Process Improvement, the term SIPOC Diagram is probably familiar to you. SIPOC is an acronym for Suppliers, Inputs, Process, Outputs, and Customers. SIPOC is a tabular summary of the inputs and outputs of or more processes. Some organizations call it COPIS which is SIPOC in reverse because they want to emphasize the value of the Customers first. But regardless, the function is the same.

They provide an overview of the project at a glance. Management can use a SIPOC Diagram to quickly explain all the project and common reference points to a team and begin to work without wasting any time. SIPOC diagrams can also assist in identifying problems and removing areas that add little value.
During the late 1980’s and early 1990’s, there was a program in the corporate & industrial world known as Total Quality Management (TQM). TQM is a management system which is based on the principle that every member of the organization must be in a climate where constant progress is made & development is made to provide quality products and services to it’s customers. Total refers to the collaboration and efforts of all departments in an organization from Sales, Marketing, Finance etc. SIPOC was believed to be first introduced and executed during the phases of this program. Today it is used as part of Six Sigma, Lean Manufacturing & Business Process Management (BPM).
Uses of a SIPOC Diagram based on the audience
- One group of audience is inclusive of those who are unfamiliar with the process and require an overview of the process. SIPOC helps avoids the hassle and educates them.
- The second group involves members who are familiar with the process but because of either being away for a long time or introduction of new changes and techniques in the process, they need to be reintroduced to it.
- The third group involves those members who are familiar with the process but are involved with the intent on changing or redefining certain areas of the existing process.
Components of a SIPOC Diagram
- Suppliers: They are the recipient of requests from the customers/businesses. They provide the inputs of the process and may be internal or external to an organization.
- Inputs: Inputs consists of all the materials, services resources, information etc needed to complete a process.
- Process: The various steps or stages which are to be followed to convert inputs into outputs.
- Outputs: The final result of the process. This may be a physical product or service or even information.
- Customers: The final recipient of the output. The customers can be either internal or external to an organization.
SIPOC Diagrams help address some key questions during the discussion process
- Who are the true valuable customers of the business?
- What changes or special requirements do customers want for the end product?
- Who are the suppliers?
Designing a SIPOC Diagram
- Begin with the process column. When you’re creating this column make sure you are fully aware of the beginning and end points of the process otherwise it can cause confusions later on. Keep the language and tone simple and clear so that unfamiliar parties can also understand.
- Next, create the output column. Here you have define the end product or result. Whether it is in terms of creating a physical output and serving it to a customer or providing a service or both, list all the possible results of the process.
- Create the customer column. Here you will identify the end user of your product or service. Remember the customer is not always external. Sometimes SIPOC diagrams are done internally for employees understanding or even for stakeholders.
- Start noting down all the inputs required for the process from Raw materials, resources, equipments, information etc.
- Write down the various suppliers of the required inputs. Note down even those specific suppliers who only provide a single necessary input for the process.
Let’s create a hypothetical SIPOC Diagram for the process of making a Coke Float
| Supplier | Input | Process | Output | Customer |
|
|
|
|
|
SIPOC Diagram is one of the oldest methods in the book when it comes to Quality Control techniques. It’s effectiveness in terms of giving overview explanations or giving the foundation for new Business Techniques and processes is unparalleled. But one begs to question, how long are we going to resort to using these age old methods?
We’ve been comfortable using them for so long, even top tier management is reluctant to try something new. When the next great disruption in business happens what are we going to do when these principles become obsolete? It’s hard to pin point when exactly this is bound to happen but better to be safe than sorry right? We’ve already begun to witness the destruction of traditional media such as Print and Television in replacement of Digital Media avenues. What’s going to be the next game changer?
Best Charts, Graphs, and Diagram Tools
- 10 Best Online Chart Maker of 2023
- 10 Best Microsoft Visio Alternatives 2023
- 10 Best Org Chart Maker of 2023
- 10 Best UML Diagram Tools 2023
- 10 Best Entity Relationship Diagram (ERD) Tools 2023
Times like these is when a team should be created within every multi billion dollar company to observe and predict market transition and prepare precautionary measures in terms of techniques and tools and educate the same to not only it’s own employees but also other industry professionals as well. Collaborative efforts and communication can go a long way in seeing the longevity of numerous companies otherwise slowly-slowly these big dollar companies will disintegrate one by one. So you know the consequences. What’s your decision going to be?
